It looks like you're using an Ad Blocker.
Please white-list or disable AboveTopSecret.com in your ad-blocking tool.
Thank you.
Some features of ATS will be disabled while you continue to use an ad-blocker.

The Benefits of Smoking
page: 8share:
originally posted by: TiredofControlFreaks
a reply to: TiredofControlFreaks
epidimiology is a soft science of statistics. It can find associations but correlation is not causation.
There is not one single disease that smokers get that non-smokers don't get as well.
Tired of Control Freaks
You have GOT to be kidding me! Your're not EVEN CLOSE to be objective here, AT ALL!
If you control for the variables, AND are using large data sets, you can not definitively say that any ONE case is caused by the main variable, however you ABSOLUTELY CAN say that the variable is a cause in MANY of the cases.
This is basic freaking science here. Simple logic. You're either being entirely intellectually dishonest, else have no clue how to critically think things through. I actually think it might be a third thing. Your reasoning is in line with a "true addict". These idiots I keep reading about who seem to have double digit IQs. I think maybe some otherwise intelligent people succumb to idiocy when they believe things which really, really need to be true to justify their poor decisions.
a reply to: AshOnMyTomatoes
The data shows the jump in liquor sales at the government owned liquor control board in Ontario. It shows that people stopped going to bars and bought their own booze and partied at home
Each bottle holds 26 ounces or 17.3 shots. A bottle costs about $35 at the liquor store but a bar charges (what???) at least $5.00 canadian per shot so each bottle is worth about $86.5 dollars (plus tips) to a bar.
That is a pretty big effect on the bar industry.
Tired of Control Freaks
OK. There is a bit of an uptick in the last few years, yes.
originally posted by: TiredofControlFreaks
a reply to: AshOnMyTomatoes
The data shows the jump in liquor sales at the government owned liquor control board in Ontario.
Whoah whoah whoah, it does not show this at all. Prove to me the increase in sales is in any way related to a smoking ban. With actual facts.
It shows that people stopped going to bars and bought their own booze and partied at homes
Krazysh0t showed here, in fact, that in the States at least business were affected not in the slightest.
edit on 19-2-2015 by AshOnMyTomatoes because: (no reason given)
Actually, I take that back. Here's a graph I made with the data you provided:
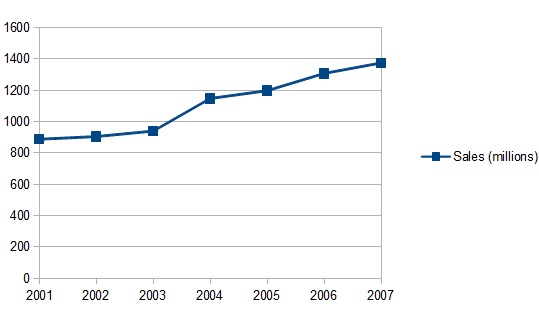
This is a linear increase in sales. There's not even any evidence that sales increased more in the years following the ban than before. You are terrible at science.
This is a linear increase in sales. There's not even any evidence that sales increased more in the years following the ban than before. You are terrible at science.
a reply to: pl3bscheese
No your logic is all wrong here.
Your statement " however you ABSOLUTELY CAN say that the variable is a cause in MANY of the cases.'
Your logic??? fails entirely on this point.
Case study: Cervical cancer - said to CAUSED by smoking - actual cause is 100 % HPV
No one knew that HPV (human pampaloma virus) existed when anti-smoker research was underway. All they knew is that smokers got cervical cancer more than non-smokers. HPV was not discovered to be a CAUSE of cancer until 1975. And it took 30 years to identify the strain of HPV that causes cervical cancer.
Now they have a vaccine for that!
The association that they thought was between smoking and cervical cancer was actually an association between sex and cervical cancer.
Jewish woman and nuns have very low rates of cervical cancer. Prostitutes had very higher rates of cervical cancer. Guess which group was more likely to smoke AND more likely to have sex???
Next case study - oral-pharangeal cancers
Same thing - smokers had a high rate or OP cancers. Non-smokers had a lower rate. Guess which group was found to be more sociable and had a higher number of sex partners?
An association is NEVER NEVER NEVER causation. Causation has to be proved by hard science. By what biological pathway does smoking cause cancer. That has never been determined.
You are the one who is mis-understanding the value of epidimiology.
Thank God - scientists don't believe that association is not causation or the real cause of cervical and OP cancers would never have been discovered.
Tired of Control Freaks
a reply to: AshOnMyTomatoes
Hey thanks - this is really good and I appreciate your efforts
However, economics is NOT science as far as I know.
The graph you posted clearly shows that the line of increase in sales is not as steep before the ban in 2006 and it is after the ban.
This clearly proves my point. If you apply a straight line from 2003, connect it to 2005 and then extropolate it, you will see what I mean
Tired of Control Freaks
It shows nothing. It shows that there was a linear increase in sales every year for 6 years. You cannot extrapolate a line drawn between a handful of points and expect that to mean something; the point of data is that the more of it you have, the better the overall picture it provides. If you want evidence that shows that banning cigarettes caused a mass exodus away from bars and towards direct liquor sales, this ain't it.
originally posted by: TiredofControlFreaks
a reply to: AshOnMyTomatoes
Hey thanks - this is really good and I appreciate your efforts
However, economics is NOT science as far as I know.
The graph you posted clearly shows that the line of increase in sales is not as steep before the ban in 2006 and it is after the ban.
This clearly proves my point. If you apply a straight line from 2003, connect it to 2005 and then extropolate it, you will see what I mean
Tired of Control Freaks
Your failure to grasp a simple data graph speaks volumes on how much your word should be trusted on matters of science.
edit on 19-2-2015 by
AshOnMyTomatoes because: (no reason given)
a reply to: AshOnMyTomatoes
Please do as I asked and use the program to extroplate a straight line using only the data prior to 2006 and then show everyone where the line ends up?
Tired of control Freaks
Please do as I asked and use the program to extroplate a straight line using only the data prior to 2006 and then show everyone where the line ends up?
Tired of control Freaks
Ain't that a rich statement? What was your posting name again?
originally posted by: TiredofControlFreaks
a reply to: AshOnMyTomatoes
Please do as I asked
No. It will end up roughly where the end of the graph is now. Certainly not far enough away to extract any meaning from it, as it will still fall well within the standard deviation. Do you know about standard deviation?
and use the program to extroplate a straight line using only the data prior to 2006 and then show everyone where the line ends up?
Tired of control Freaks
originally posted by: Myomistress
a reply to: TiredofControlFreaks
I'd say just using logic that for the case of my great grandmother at least, it was the smoking. She'd smoked like a chimney earlier in life and it caught up with her. There were no other airborne reasons for her to produce emphysema. There was no radon in her basement or other toxins. I'd assume this because her daughter still lives in that house and has for almost seventy years and has not shown any problems with her lungs thus far at all. If it were another environmental factor within the house, then she would have problems with her lungs as well. Smoking is also the most common cause for COPD so I'm just going to have to go with occam's razor on this one.
But one with Occam's razor, might say, how come the Chinese smoke like their is no tomorrow and don't get the smoking related diseases. It wouldn't be anything to do with diet would it? They don't get high Blood pressure, They don't get Breast, or Prostate cancer , or Diabetes either. If anyone thinks that smoking is causing the disease spikes in the western world, then they are so dumb, they deserve all they get.
I smoke about twelve cigs a day, My blood pressure was 180/90, now its 117/78 I"m 67, and still smoke about twelve cigs a day. How? just cut out all the crap Dairy, that's the real killer like it always was.
a reply to: AshOnMyTomatoes
yes I know about standard deviation.
Why don't you go ahead and calcualate it - then we can do a bell curve and see if the increase that happened after 2006 is within the norm?
Can 1 person ask another person to do something while saying please and NOT be considered a control freak?
Tired of Control Freaks
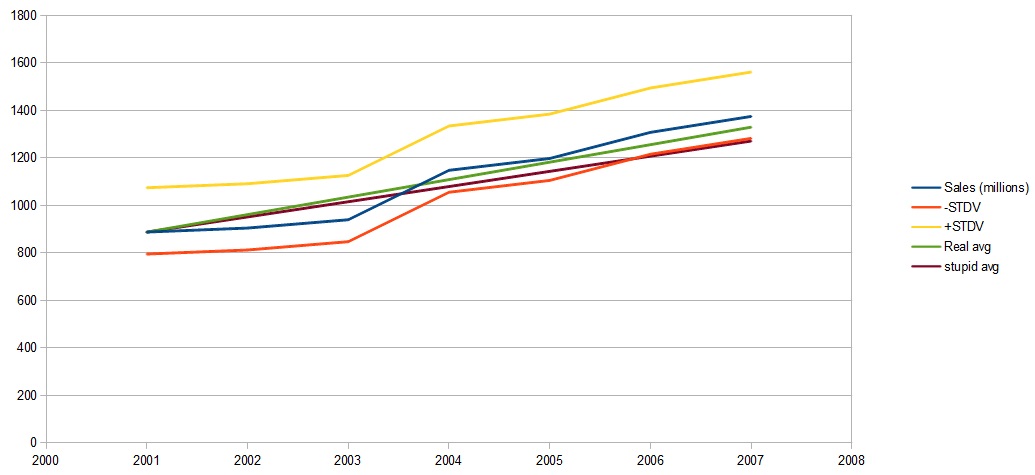
The two straight lines are the slope of the entire graph, and the slope of the graph using only your cherrypicked data. They both fall within the standard deviation envelope, which is the upper and lower curve. There is no evidence to support your claim.
a reply to: AshOnMyTomatoes
thank you very much.
I do have a question though. When you calculated the slope and the standard deviation - would it not be more accurate to calculate the slope and standard deviation for the pre-ban data 2001 to 2005 first. Then calculate the slope and standard deviation for the post ban data 2006 onwards?
BTW - this isn't MY cherry picked data. This data is from a government quarterly report! I provided the links for others to see.
Tired of Control Freaks
a reply to: TiredofControlFreaks
BTW - my mathematical skills and I am not so good with excell either.
Tired of Control Feaks
BTW - my mathematical skills and I am not so good with excell either.
Tired of Control Feaks
As I said, there are two slopes shown on the graph. I'm slightly color blind, so I can't actually tell which is which, but they are very close to each other and are labeled on the graph. One is for only the 01-05 data, the other is for all the data. They are close enough that the difference doesn't matter. The standard deviation would not change much either if I dropped the last 2 years off the calculation, and the lines representing the slopes would still fall within them.
originally posted by: TiredofControlFreaks
a reply to: AshOnMyTomatoes
thank you very much.
I do have a question though. When you calculated the slope and the standard deviation - would it not be more accurate to calculate the slope and standard deviation for the pre-ban data 2001 to 2005 first. Then calculate the slope and standard deviation for the post ban data 2006 onwards?
BTW - this isn't MY cherry picked data. This data is from a government quarterly report! I provided the links for others to see.
Tired of Control Freaks
The correct way to interpret this graph would be "the sales of government liquor progressed in a linear fashion for every year in the data provided, given the error bars calculated and shown on the graph". It would take a very sharp spike to indicate that some force was having a major impact on these sales; such a spike is not evident.
And by "cherry-picked data" I meant the data in the ranges you were asking for, pre-ban only.
edit on 19-2-2015 by AshOnMyTomatoes because: (no
reason given)
Hah! I forgot that would show up. That was the average I was calculating that only included pre-ban numbers.
originally posted by: TiredofControlFreaks
a reply to: AshOnMyTomatoes
what is the line that is the stupid average?
Tired of Control Freaks
a reply to: AshOnMyTomatoes
The lines show that the stupid average line falls below the orange -standard deviation. So that shows that there is a difference between the slope of the line between the stupid average (pre-ban data) and the actual average line
Tired of Control Freaks
The lines show that the stupid average line falls below the orange -standard deviation. So that shows that there is a difference between the slope of the line between the stupid average (pre-ban data) and the actual average line
Tired of Control Freaks
a reply to: TiredofControlFreaks
You compared the slope of the stupid average with the slope of the real average (that includes pre-and post data) That is not a accurate comparison, is it?
Tired of Control Freaks
You compared the slope of the stupid average with the slope of the real average (that includes pre-and post data) That is not a accurate comparison, is it?
Tired of Control Freaks
new topics
-
Is the origin for the Eye of Horus the pineal gland?
General Conspiracies: 49 minutes ago -
Man sets himself on fire outside Donald Trump trial
Mainstream News: 1 hours ago -
Biden says little kids flip him the bird all the time.
2024 Elections: 1 hours ago -
The Democrats Take Control the House - Look what happened while you were sleeping
US Political Madness: 1 hours ago -
Sheetz facing racial discrimination lawsuit for considering criminal history in hiring
Social Issues and Civil Unrest: 1 hours ago -
In an Historic First, In N Out Burger Permanently Closes a Location
Mainstream News: 3 hours ago -
MH370 Again....
Disaster Conspiracies: 4 hours ago -
Are you ready for the return of Jesus Christ? Have you been cleansed by His blood?
Religion, Faith, And Theology: 6 hours ago -
Chronological time line of open source information
History: 7 hours ago -
A man of the people
Diseases and Pandemics: 9 hours ago
top topics
-
Israeli Missile Strikes in Iran, Explosions in Syria + Iraq
World War Three: 17 hours ago, 19 flags -
In an Historic First, In N Out Burger Permanently Closes a Location
Mainstream News: 3 hours ago, 14 flags -
The Democrats Take Control the House - Look what happened while you were sleeping
US Political Madness: 1 hours ago, 8 flags -
Thousands Of Young Ukrainian Men Trying To Flee The Country To Avoid Conscription And The War
Other Current Events: 14 hours ago, 7 flags -
Iran launches Retalliation Strike 4.18.24
World War Three: 17 hours ago, 6 flags -
12 jurors selected in Trump criminal trial
US Political Madness: 17 hours ago, 4 flags -
4 plans of US elites to defeat Russia
New World Order: 10 hours ago, 4 flags -
A man of the people
Diseases and Pandemics: 9 hours ago, 4 flags -
Man sets himself on fire outside Donald Trump trial
Mainstream News: 1 hours ago, 4 flags -
Biden says little kids flip him the bird all the time.
2024 Elections: 1 hours ago, 3 flags
active topics
-
Thousands Of Young Ukrainian Men Trying To Flee The Country To Avoid Conscription And The War
Other Current Events • 25 • : twistedpuppy -
Silent Moments --In Memory of Beloved Member TDDA
Short Stories • 46 • : Encia22 -
Man sets himself on fire outside Donald Trump trial
Mainstream News • 8 • : BernnieJGato -
12 jurors selected in Trump criminal trial
US Political Madness • 73 • : ImagoDei -
The Democrats Take Control the House - Look what happened while you were sleeping
US Political Madness • 15 • : matafuchs -
Are you ready for the return of Jesus Christ? Have you been cleansed by His blood?
Religion, Faith, And Theology • 17 • : TheValeyard -
Israeli Missile Strikes in Iran, Explosions in Syria + Iraq
World War Three • 100 • : Astrocometus -
Biden says little kids flip him the bird all the time.
2024 Elections • 5 • : TheValeyard -
President BIDEN Warned IRAN Not to Attack ISRAEL - Iran Responded with a Military Attack on Israel.
World War Three • 46 • : ImagoDei -
"We're All Hamas" Heard at Columbia University Protests
Social Issues and Civil Unrest • 131 • : marg6043