It looks like you're using an Ad Blocker.
Please white-list or disable AboveTopSecret.com in your ad-blocking tool.
Thank you.
Some features of ATS will be disabled while you continue to use an ad-blocker.

Earthquake Summaries 2014
page: 110
share:
Due to Quake Watch 2014 being closed down for posting prior to the years summaries being put up, I have created this new thread to do so.
Because its where I live, New Zealand will be the first review/summary.
In 2014 within the area of Lat -32.28 to -49.1, (Scholl Deep in the Kermadec Trench to midway between Broughton Ilsand and the Auckland Islands in the south) and Long 163.6 to -182.988 there were;
mag1= 8,572
mag2= 10,608
mag3= 1,501
mag4= 341
mag5= 34
mag6= 6
mag7= 0
Total = 21,062 events
Total Energy Released= 397,239.365TTNT
This differs from past years as it does not include the Kermadec Islands themselves. I may redo that later for consistency, but this is a preliminary review anyway and will do for now.
Because Google Maps have chopped back on the number of icons one can place on their maps, I can't do a interactive Map for the whole years events now, just too many icons/events.
But here is a screenshot using GPS Visualiser. I have pointed to the main M6 events for 2014
(click image for larger version, opens in new tab/window)
the entire series of 2014 events can be viewed (on a daily basis) at NZ 2014
and an M5+ interactive map for 2014 can be viewed here
Main significant events (M6+) for 2014 were;
Ref: 2014p051675
Lat/Long: -40.620579, 175.86497
Date/Time UTC: 20/01/2014 02:52:46
Depth: 34.18 km
Mag: 6.23 ML
Location: Alfredton, Wairarapa
Ref: 2014p090816
Lat/Long: -33.05032, -177.89363
Date/Time UTC: 03/02/2014 14:26:18
Depth: 33 km
Mag: 5.24 ML
Location: South Of Kermadec Islands
Ref: 2014p537205
Lat/Long: -34.797436, -179.16528
Date/Time UTC: 18/07/2014 18:23:04
Depth: 33 km
Mag: 6.01 ML
Location: South Of Kermadec Islands
Ref: 2014p773447
Lat/Long: -34.834404, -179.822937
Date/Time UTC: 14/10/2014 04:12:30
Depth: 33 km
Mag: 6.51 ML
Location: South Of Kermadec Islands
Ref: 2014p770859
Lat/Long: -46.2894707, 165.8665924
Date/Time UTC: 13/10/2014 05:13:42
Depth: 9.73 km
Mag: 6.19 ML
Location: NW Puysegur Bank (South West of the South Island)
Ref: 2014p864702
Lat/Long: -37.5973199, -179.8875817
Date/Time UTC: 16/11/2014 22:33:18
Depth: 32.19 km
Mag: 6.48 ML
Location: East Cape Ridge Off NI N.Z.
data from Geonet.
Because its where I live, New Zealand will be the first review/summary.
In 2014 within the area of Lat -32.28 to -49.1, (Scholl Deep in the Kermadec Trench to midway between Broughton Ilsand and the Auckland Islands in the south) and Long 163.6 to -182.988 there were;
mag1= 8,572
mag2= 10,608
mag3= 1,501
mag4= 341
mag5= 34
mag6= 6
mag7= 0
Total = 21,062 events
Total Energy Released= 397,239.365TTNT
This differs from past years as it does not include the Kermadec Islands themselves. I may redo that later for consistency, but this is a preliminary review anyway and will do for now.
Because Google Maps have chopped back on the number of icons one can place on their maps, I can't do a interactive Map for the whole years events now, just too many icons/events.
But here is a screenshot using GPS Visualiser. I have pointed to the main M6 events for 2014
(click image for larger version, opens in new tab/window)

the entire series of 2014 events can be viewed (on a daily basis) at NZ 2014
and an M5+ interactive map for 2014 can be viewed here
Main significant events (M6+) for 2014 were;
Ref: 2014p051675
Lat/Long: -40.620579, 175.86497
Date/Time UTC: 20/01/2014 02:52:46
Depth: 34.18 km
Mag: 6.23 ML
Location: Alfredton, Wairarapa
Ref: 2014p090816
Lat/Long: -33.05032, -177.89363
Date/Time UTC: 03/02/2014 14:26:18
Depth: 33 km
Mag: 5.24 ML
Location: South Of Kermadec Islands
Ref: 2014p537205
Lat/Long: -34.797436, -179.16528
Date/Time UTC: 18/07/2014 18:23:04
Depth: 33 km
Mag: 6.01 ML
Location: South Of Kermadec Islands
Ref: 2014p773447
Lat/Long: -34.834404, -179.822937
Date/Time UTC: 14/10/2014 04:12:30
Depth: 33 km
Mag: 6.51 ML
Location: South Of Kermadec Islands
Ref: 2014p770859
Lat/Long: -46.2894707, 165.8665924
Date/Time UTC: 13/10/2014 05:13:42
Depth: 9.73 km
Mag: 6.19 ML
Location: NW Puysegur Bank (South West of the South Island)
Ref: 2014p864702
Lat/Long: -37.5973199, -179.8875817
Date/Time UTC: 16/11/2014 22:33:18
Depth: 32.19 km
Mag: 6.48 ML
Location: East Cape Ridge Off NI N.Z.
data from Geonet.
edit on 01000000161615 by muzzy because: missed one of these /
Of course more detail can be added,
such as
how many aftershocks were there to the Alfredton quake? (the 1st anniversary is in 2 days)
how many aftershocks of the 2010-2011 series did Christchurch have in 2014 and what was the biggest one?
what about the Cook Strait 2013 quakes aftershocks in 2014?
where there any other notable swarms or large quakes as well as the 6's?
and how did 2014 compare to other years? (probably need a table for that)
all takes time to gather up the data and break it down.
As well there are 20 other Earthquake Monitoring Networks I use for other countries, that can be given the annual review treatment.
Anyone else is welcome to contribute too, if you have been keeping a record of your area, please put the info up.
edit on 01000000161615 by muzzy because: (no reason given)
Ever thought about rendering a world atlas in the way you've done with New Zealand?
a reply to: Asynchrony
Yes I wish it were possible.
Unfortunately the current situation is that Google Maps have complete control over the use of interactive maps on the Internet, even the Topo map I use now is overlaid on GMaps so that it works interactively.
There are some other Topo maps available such as USGS , Canada and Italy, but they all have different scales.
There is also a limit to the number of icons you can use on Google Maps, Bing and Open Street Maps too.
iki Maps is getting close to what I would like to use, but it has this hangup of when you go Worldwide the map splits into West and East at the anti-meridian and the icons that are each side of it end up at opposite sides of the map even when they might just be 2km from each other.
there is a lot of work to be done yet in digital mapping, at the moment its really only basic stuff.
With World wide mapping on the Internet we are stuck with Gmaps, Street, Terrain and Satellite views
In answer to the first question
1. how many aftershocks were there to the Alfredton quake? (the 1st anniversary is in 2 days)
to the end of 2014 there were total of 4,501
mag1= 3,344
mag2= 1,017
mag3= 122
mag4= 16
mag5= 1
mag6= 1
Total Energy Released = 37,174.58TTNT
35,709.657 of it in the 6.23 main shock and that single 5.46 aftershock 8 months later.
I didn't do a map yet, I stuffed up the data file and deleted the time coulmn by mistake. I'll do it again in a couple of days.
the search co-ords are Lat -40.52, -40.75, Long 175.68, 176.04, which is no more than 17.5 km radius from the mainshock.
It was on the Pa Valley Fault
edit on 01u161615 by muzzy because: (no reason given)
a reply to: muzzy
The first mapping site I remember using back in 1997 was mapquest. That was when Webcrawler was the search engine we all used. Well I guess that because of the way things are now with the online maps and the monopoly that Google has on them you'd need to build your own mapping site to get the maps all on the same code. Sounds like a patchwork quilt the way you described the way it is right now.
The first mapping site I remember using back in 1997 was mapquest. That was when Webcrawler was the search engine we all used. Well I guess that because of the way things are now with the online maps and the monopoly that Google has on them you'd need to build your own mapping site to get the maps all on the same code. Sounds like a patchwork quilt the way you described the way it is right now.
a reply to: muzzy
correction.
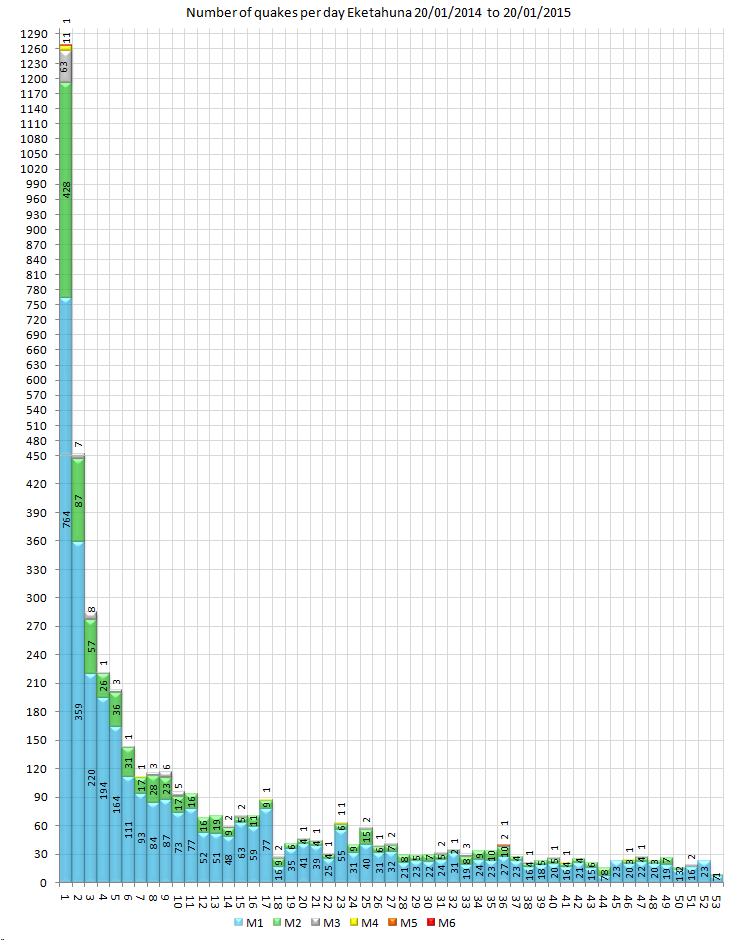
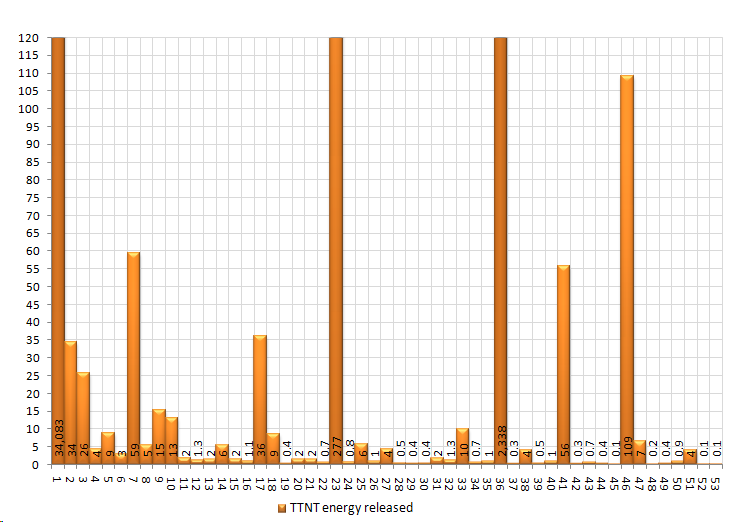
I have done an animation using updated data from this last week of the whole 53 weeks since the Eketahuna M6.23
on review there were;
mag1= 3449
mag2= 1035
mag3= 125
mag4= 16
mag5= 1
mag6= 1
total= 4,627
TTNT= 37143.1793
I didn't count the ~M1's as they just got in the way of the scaling, which was a mission as each week was different.
I won't waste ATS data storage space by loading the animation as it is 2.9MB, but you can see it here
NZ Historical M5+ EQ, 2014
or here
Dropbox
but here's the 53 week graphs (doesn't use up so much data)
right click "view image" for full size
correction.
I have done an animation using updated data from this last week of the whole 53 weeks since the Eketahuna M6.23
on review there were;
mag1= 3449
mag2= 1035
mag3= 125
mag4= 16
mag5= 1
mag6= 1
total= 4,627
TTNT= 37143.1793
I didn't count the ~M1's as they just got in the way of the scaling, which was a mission as each week was different.
I won't waste ATS data storage space by loading the animation as it is 2.9MB, but you can see it here
NZ Historical M5+ EQ, 2014
or here
Dropbox
edit on 01000000232315 by muzzy because: (no reason given)
but here's the 53 week graphs (doesn't use up so much data)
right click "view image" for full size
edit on 01u232315 by muzzy because: (no reason given)
new topics
-
VERY IMPORTANT..............
2024 Elections: 10 minutes ago -
Biden--My Uncle Was Eaten By Cannibals
US Political Madness: 17 minutes ago -
"We're All Hamas" Heard at Columbia University Protests
Social Issues and Civil Unrest: 18 minutes ago -
The good, the Bad and the Ugly!
Diseases and Pandemics: 2 hours ago -
Russian intelligence officer: explosions at defense factories in the USA and Wales may be sabotage
Weaponry: 4 hours ago -
African "Newcomers" Tell NYC They Don't Like the Free Food or Shelter They've Been Given
Social Issues and Civil Unrest: 5 hours ago -
Russia Flooding
Other Current Events: 6 hours ago -
MULTIPLE SKYMASTER MESSAGES GOING OUT
World War Three: 7 hours ago -
Two Serious Crimes Committed by President JOE BIDEN that are Easy to Impeach Him For.
US Political Madness: 8 hours ago -
911 emergency lines are DOWN across multiple states
Breaking Alternative News: 8 hours ago
top topics
-
Go Woke, Go Broke--Forbes Confirms Disney Has Lost Money On Star Wars
Movies: 15 hours ago, 13 flags -
Pro Hamas protesters at Columbia claim hit with chemical spray
World War Three: 11 hours ago, 11 flags -
Elites disapearing
Political Conspiracies: 13 hours ago, 9 flags -
Freddie Mercury
Paranormal Studies: 15 hours ago, 7 flags -
African "Newcomers" Tell NYC They Don't Like the Free Food or Shelter They've Been Given
Social Issues and Civil Unrest: 5 hours ago, 7 flags -
911 emergency lines are DOWN across multiple states
Breaking Alternative News: 8 hours ago, 6 flags -
Two Serious Crimes Committed by President JOE BIDEN that are Easy to Impeach Him For.
US Political Madness: 8 hours ago, 5 flags -
A Personal Cigar UFO/UAP Video footage I have held onto and will release it here and now.
Aliens and UFOs: 13 hours ago, 5 flags -
Former NYT Reporter Attacks Scientists For Misleading Him Over COVID Lab-Leak Theory
Education and Media: 10 hours ago, 4 flags -
Biden--My Uncle Was Eaten By Cannibals
US Political Madness: 17 minutes ago, 4 flags
active topics
-
VERY IMPORTANT..............
2024 Elections • 1 • : network dude -
Russian intelligence officer: explosions at defense factories in the USA and Wales may be sabotage
Weaponry • 100 • : RussianTroll -
Biden--My Uncle Was Eaten By Cannibals
US Political Madness • 4 • : DAVID64 -
Nirvana - Immigrant Song
Music • 8 • : PHYSIC2X -
Go Woke, Go Broke--Forbes Confirms Disney Has Lost Money On Star Wars
Movies • 17 • : PHYSIC2X -
A Personal Cigar UFO/UAP Video footage I have held onto and will release it here and now.
Aliens and UFOs • 11 • : PHYSIC2X -
Elites disapearing
Political Conspiracies • 24 • : PHYSIC2X -
Pro Hamas protesters at Columbia claim hit with chemical spray
World War Three • 13 • : PHYSIC2X -
Russia Flooding
Other Current Events • 5 • : Hakaiju -
"We're All Hamas" Heard at Columbia University Protests
Social Issues and Civil Unrest • 0 • : FlyersFan
10