It looks like you're using an Ad Blocker.
Please white-list or disable AboveTopSecret.com in your ad-blocking tool.
Thank you.
Some features of ATS will be disabled while you continue to use an ad-blocker.

The Obama Economy
page: 2share:
Obama won't take responsibility for anything negative, claiming that it isn't his fault, so in turn he should not get credit for any of this when none
of it is due to his actions.
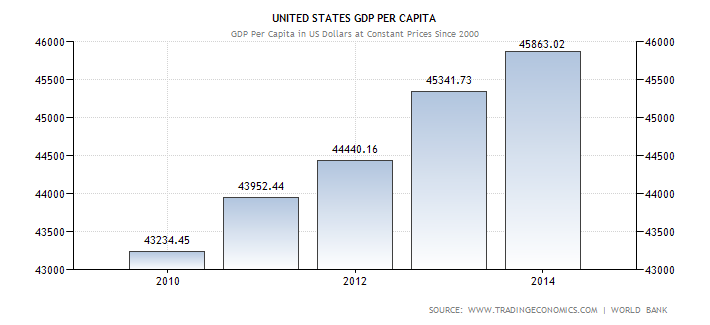
As far as taking credit for the GDP increase, why don't we wait for January 30 when the 4th quarter numbers get released before we get all excited about the "growth".
As far as taking credit for the GDP increase, why don't we wait for January 30 when the 4th quarter numbers get released before we get all excited about the "growth".
edit on 1/14/2015 by SpaDe_ because: wording
a reply to: Bilk22
And the people who just give up because they can't find anything.
Don't get counted.
Fuzzy government accounting.
The government counts only people actively looking for jobs as unemployed. T
And the people who just give up because they can't find anything.
Don't get counted.
Fuzzy government accounting.
edit on 14-1-2015 by neo96 because: (no reason given)
originally posted by: neo96
originally posted by: Connector
originally posted by: neo96
And under the Obama economy over 100 million people are out of work
So the unemployment is really 33%ish? One in three americans are unemployed? Link please.....
www.businessinsider.com...
Just have to call out your BS here as it is just so ...
Your link above shows an obscure graph from 2012...Specifically the CNP16OV..see below
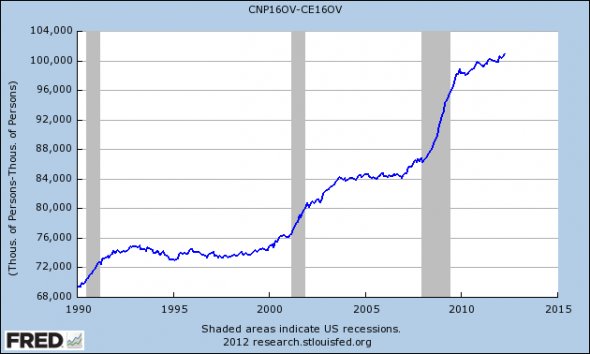
Your OP-ED cites it while discussing the "real" unemployment numbers...Looks like a pretty ugly graph doesn't it?
Ya know what the CNP16OV is????
POPULATION IN THE USA OVER THE AGE OF 16, NOT UNEMPLOYMENT.
Civilian noninstitutional population is defined as persons 16 years of age and older residing in the 50 states and the District of Columbia, who are not inmates of institutions (e.g., penal and mental facilities, homes for the aged), and who are not on active duty in the Armed Forces.
The series comes from the 'Current Population Survey (Household Survey)'
research.stlouisfed.org...
Yes..it shows that people live longer these days...Now if the GOP can only get those pesky elderly and retired to WORK!
True, but to be fair, this is how it's always been done. However economists know what to really look at when judging the health of the economy.
originally posted by: neo96
a reply to: Bilk22
The government counts only people actively looking for jobs as unemployed. T
And the people who just give up because they can't find anything.
Don't get counted.
Fuzzy government accounting.
Instead of calling BS why not look for the real numbers?
originally posted by: Indigo5
originally posted by: neo96
originally posted by: Connector
originally posted by: neo96
And under the Obama economy over 100 million people are out of work
So the unemployment is really 33%ish? One in three americans are unemployed? Link please.....
www.businessinsider.com...
Just have to call out your BS here as it is just so ...
Your link above shows an obscure graph from 2012...Specifically the CNP16OV..see below
Your OP-ED cites it while discussing the "real" unemployment numbers...Looks like a pretty ugly graph doesn't it?
Ya know what the CNP16OV is????
POPULATION IN THE USA OVER THE AGE OF 16, NOT UNEMPLOYMENT.
Civilian noninstitutional population is defined as persons 16 years of age and older residing in the 50 states and the District of Columbia, who are not inmates of institutions (e.g., penal and mental facilities, homes for the aged), and who are not on active duty in the Armed Forces.
The series comes from the 'Current Population Survey (Household Survey)'
research.stlouisfed.org...
Yes..it shows that people live longer these days...Now if the GOP can only get those pesky elderly and retired to WORK!
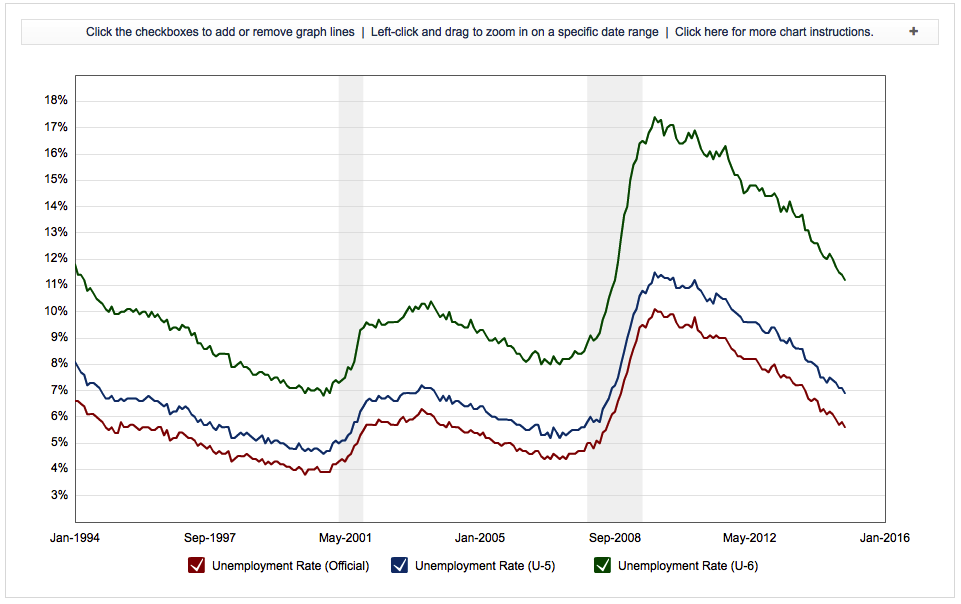
U6 < HERE
edit on 84618Wednesdayk22 by Bilk22 because: (no reason
given)
originally posted by: SpaDe_
As far as taking credit for the GDP increase, why don't we wait for January 30 when the 4th quarter numbers get released before we get all excited about the "growth".
Right..wait for January numbers before declaring a trend! Ignore the last 60 months! The GOP CHEERING FOR THE US ECONOMY TO FAIL
Oil and Gasoline bulk prices are determined by international market trading.
Governments add taxes.
I think the upswing in U.S. GDP might have something to do with the recent inflated oil and gas prices.
Even back in the 90's when the oil price was below $20, many people still made billions.
Sounds like somebody is getting real nervous about 2016 !!!
The economy right now is garbage for too many people.
I see your chart and raise you
originally posted by: Indigo5
originally posted by: SpaDe_
As far as taking credit for the GDP increase, why don't we wait for January 30 when the 4th quarter numbers get released before we get all excited about the "growth".
Right..wait for January numbers before declaring a trend! Ignore the last 60 months! The GOP CHEERING FOR THE US ECONOMY TO FAIL
Link
originally posted by: Bilk22
Instead of calling BS why not look for the real numbers?
originally posted by: Indigo5
originally posted by: neo96
originally posted by: Connector
originally posted by: neo96
And under the Obama economy over 100 million people are out of work
So the unemployment is really 33%ish? One in three americans are unemployed? Link please.....
www.businessinsider.com...
Just have to call out your BS here as it is just so ...
Your link above shows an obscure graph from 2012...Specifically the CNP16OV..see below
Your OP-ED cites it while discussing the "real" unemployment numbers...Looks like a pretty ugly graph doesn't it?
Ya know what the CNP16OV is????
POPULATION IN THE USA OVER THE AGE OF 16, NOT UNEMPLOYMENT.
Civilian noninstitutional population is defined as persons 16 years of age and older residing in the 50 states and the District of Columbia, who are not inmates of institutions (e.g., penal and mental facilities, homes for the aged), and who are not on active duty in the Armed Forces.
The series comes from the 'Current Population Survey (Household Survey)'
research.stlouisfed.org...
Yes..it shows that people live longer these days...Now if the GOP can only get those pesky elderly and retired to WORK!
U6 < HERE
Oh...you mean the unemployment measure that skyrocketed under the last GOP administration and has steadily fell under the current one?
That is the "True" unemployment rate?
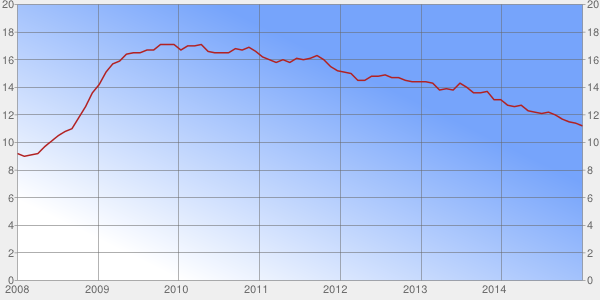
www.tradingeconomics.com...
Maybe you guys should go back to just claiming he was born in Kenya...An illegitimate president that has done more for the US economy than the wildest campaign promise of the GOP last election.
edit on 14-1-2015 by Indigo5 because: (no reason given)
originally posted by: Indigo5
Mitt Romney promised by the end of his first term (December 2016) he would achieve
GDP Growth 4% by end of 2016
Unemployment at 5.9% by the end of 2016
www.nationalreview.com...
Current (December 2014)
GDP Growth is 5%
Unemployment is at 5.6%
Michelle Bachmann promised us in 2012 that she would give us $2 gas by 2016 if we made her President!
Bachmann: I'll bring back $2 gas
money.cnn.com...
We are now at $2 dollars a gallon 2 years later. Though Bachmann would like us to believe she made it happen
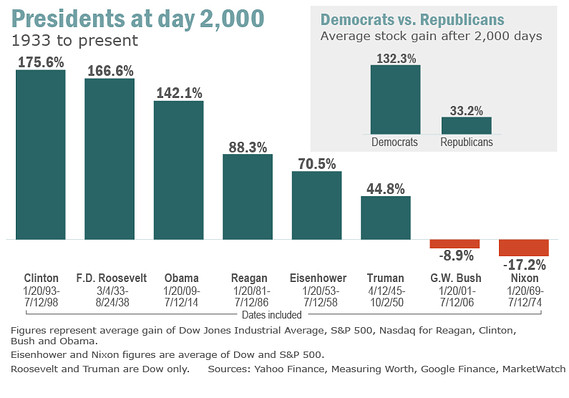
Stock Market?
Unemployment?
The work that remains to be done is average wages and over-sized income distribution disparity…both topics that the GOP very loudly OPPOSE addressing.
So I am just curious…since the current President has exceeded the ambitious claims the GOP candidates for President made, and done so two years early…what economic policy criticisms will they employ in the coming election? By all objective accounts, the GOP should be applauding the economic achievements of this administration.


It must be April 1st. Surely no one can believe this drivel.
Oh and instead of just regurgitating a chart with little reference to the true economy and population, it's useless and really false.
originally posted by: Indigo5
originally posted by: SpaDe_
As far as taking credit for the GDP increase, why don't we wait for January 30 when the 4th quarter numbers get released before we get all excited about the "growth".
Right..wait for January numbers before declaring a trend! Ignore the last 60 months! The GOP CHEERING FOR THE US ECONOMY TO FAIL
Here this should help you.
The Fiscal and Economic Impact of Immigration on the United States
LOL yeah and you do realize that all the numbers are higher than they've ever been? Is math your strong suit?
originally posted by: Indigo5
originally posted by: Bilk22
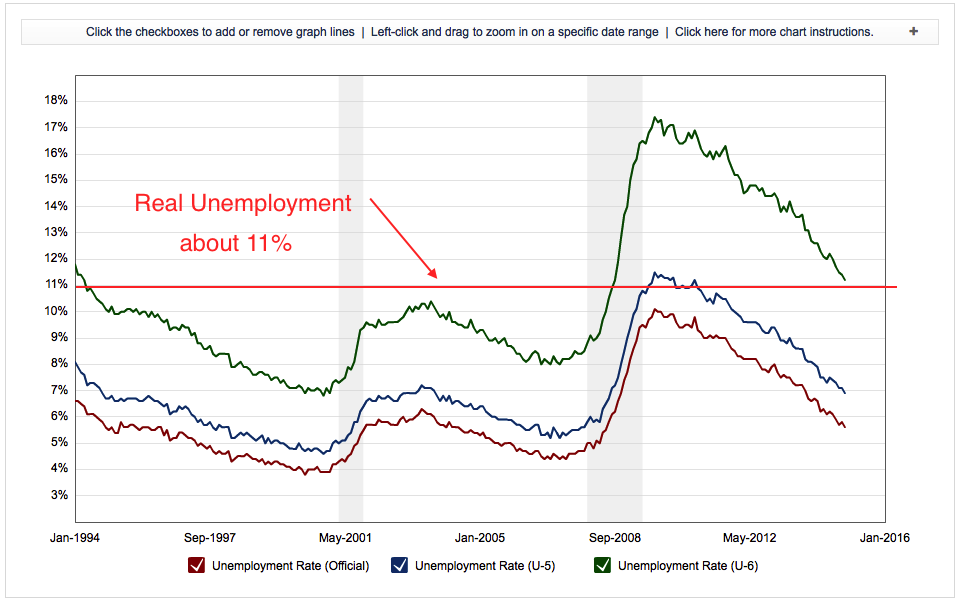
I see your chart and raise you
originally posted by:
Link
You do realize that chart shows three different unemployment Measures ALL DIVING DOWNWARD since the president took office?
a reply to: Indigo5
I was just about to say that it does appear in my professional opinion that the graph does indeed show unemployment lowering since around 2009.
lol.
This thread is so funny obvious OB haters getting the stars they want while posting falsehoods.
Me not that bothered but blimey the right wing element of ATS sure love to tell fibs and mudsling.
Using the charts and data provided, point to the lies. Go ahead if you're capable Mr. Professional.
originally posted by: boymonkey74
a reply to: Indigo5
I was just about to say that it does appear in my professional opinion that the graph does indeed show unemployment lowering since around 2009.
lol.
This thread is so funny obvious OB haters getting the stars they want while posting falsehoods.
Me not that bothered but blimey the right wing element of ATS sure love to tell fibs and mudsling.
Any chart or graph that does not show its math on either side, is propaganda. They have changed the formula so many times no two pieces of data are
apples to apples. There is no factual argument to be had here, it's all disinformation and zealotry.
originally posted by: Bilk22
Oh and instead of just regurgitating a chart with little reference to the true economy and population, it's useless and really false.
originally posted by: Indigo5
originally posted by: SpaDe_
As far as taking credit for the GDP increase, why don't we wait for January 30 when the 4th quarter numbers get released before we get all excited about the "growth".
Right..wait for January numbers before declaring a trend! Ignore the last 60 months! The GOP CHEERING FOR THE US ECONOMY TO FAIL
Here this should help you.
The Fiscal and Economic Impact of Immigration on the United States
Thanks for answering my question about how the GOP are going face the significant economic gains under a Democratic Administration in 2016....They will derail and talk about Immigration!
Hey Mitt...what do you think about President Obama's economic policies exceeding your own goals when you last ran for President?....Uh....I think our borders need to be secure!!
This looks pretty real and the way the data is collected and the parameters haven't changed.
originally posted by: ISawItFirst
Any chart or graph that does not show its math on either side, is propaganda. They have changed the formula so many times no two pieces of data are apples to apples. There is no factual argument to be had here, it's all disinformation and zealotry.
originally posted by: ISawItFirst
Any chart or graph that does not show its math on either side, is propaganda. They have changed the formula so many times no two pieces of data are apples to apples. There is no factual argument to be had here, it's all disinformation and zealotry.
No...the formulas for calculating the various Unemployment measures and GDP have remained consistent for decades.
The GOP have changed which measure to cite, depending on which is most convenient, but when time-trends are examined in any of those measures they all reflect the same improvement.
new topics
-
Man sets himself on fire outside Donald Trump trial
Mainstream News: 8 minutes ago -
Biden says little kids flip him the bird all the time.
2024 Elections: 14 minutes ago -
The Democrats Take Control the House - Look what happened while you were sleeping
US Political Madness: 50 minutes ago -
Sheetz facing racial discrimination lawsuit for considering criminal history in hiring
Social Issues and Civil Unrest: 55 minutes ago -
In an Historic First, In N Out Burger Permanently Closes a Location
Mainstream News: 2 hours ago -
MH370 Again....
Disaster Conspiracies: 3 hours ago -
Are you ready for the return of Jesus Christ? Have you been cleansed by His blood?
Religion, Faith, And Theology: 5 hours ago -
Chronological time line of open source information
History: 6 hours ago -
A man of the people
Diseases and Pandemics: 8 hours ago -
Ramblings on DNA, blood, and Spirit.
Philosophy and Metaphysics: 8 hours ago
top topics
-
Israeli Missile Strikes in Iran, Explosions in Syria + Iraq
World War Three: 16 hours ago, 18 flags -
In an Historic First, In N Out Burger Permanently Closes a Location
Mainstream News: 2 hours ago, 14 flags -
Thousands Of Young Ukrainian Men Trying To Flee The Country To Avoid Conscription And The War
Other Current Events: 13 hours ago, 7 flags -
Iran launches Retalliation Strike 4.18.24
World War Three: 16 hours ago, 6 flags -
The Democrats Take Control the House - Look what happened while you were sleeping
US Political Madness: 50 minutes ago, 6 flags -
12 jurors selected in Trump criminal trial
US Political Madness: 16 hours ago, 4 flags -
4 plans of US elites to defeat Russia
New World Order: 10 hours ago, 4 flags -
A man of the people
Diseases and Pandemics: 8 hours ago, 4 flags -
Sheetz facing racial discrimination lawsuit for considering criminal history in hiring
Social Issues and Civil Unrest: 55 minutes ago, 2 flags -
Are you ready for the return of Jesus Christ? Have you been cleansed by His blood?
Religion, Faith, And Theology: 5 hours ago, 2 flags
active topics
-
Israeli Missile Strikes in Iran, Explosions in Syria + Iraq
World War Three • 91 • : CarlLaFong -
12 jurors selected in Trump criminal trial
US Political Madness • 60 • : ImagoDei -
The Democrats Take Control the House - Look what happened while you were sleeping
US Political Madness • 12 • : ImagoDei -
Man sets himself on fire outside Donald Trump trial
Mainstream News • 0 • : Mantiss2021 -
Are you ready for the return of Jesus Christ? Have you been cleansed by His blood?
Religion, Faith, And Theology • 16 • : FlyersFan -
MH370 Again....
Disaster Conspiracies • 6 • : KnowItAllKnowNothin -
Biden says little kids flip him the bird all the time.
2024 Elections • 0 • : 5thHead -
4 plans of US elites to defeat Russia
New World Order • 34 • : Oldcarpy2 -
Sheetz facing racial discrimination lawsuit for considering criminal history in hiring
Social Issues and Civil Unrest • 2 • : Hecate666 -
Fossils in Greece Suggest Human Ancestors Evolved in Europe, Not Africa
Origins and Creationism • 71 • : Consvoli