It looks like you're using an Ad Blocker.
Please white-list or disable AboveTopSecret.com in your ad-blocking tool.
Thank you.
Some features of ATS will be disabled while you continue to use an ad-blocker.

The ABC's of debating AGW.
page: 2share:
a reply to: intrepid
Yeah...right. Fortunately science is not conducted via consensus, but rather by the scientific method.
Peruse this:

Source
You see, I respect the fact that you know more about these things than I do. I am merely a semi retired geologist who no longer practices.
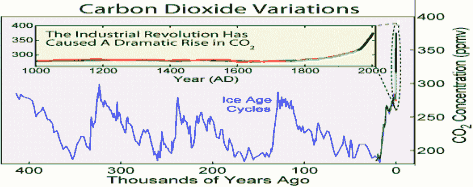
As you can see, we are not outside any norms as exhibited by previous interglacial periods.
Yeah...right. Fortunately science is not conducted via consensus, but rather by the scientific method.
Peruse this:
Source
You see, I respect the fact that you know more about these things than I do. I am merely a semi retired geologist who no longer practices.
As you can see, we are not outside any norms as exhibited by previous interglacial periods.
edit on 15-9-2014 by bbracken677 because: (no reason given)
a reply to: bbracken677
I think the point that AGW proponents are trying to make is that the current rate of increase in CO2 levels is being termed as "unprecidented", meaning that CO2 levels are increasing at an alarming rate, aka: not normal.
But the problem with that claim is there is no way to measure historical rates of increase, all they can do is smooth the data over thousands of years due to lack of detailed source data.
So it's yet another AGW claim based on nothing but hyperbolic supposition.
You cannot claim something is out of the ordinary if there is no way to determine what 'normal' actually is. But for whatever reason, this particular branch of science seems to think that it can.
Al Gore misrepresented the truth in his Mockumentary. Co2 levels have been as high as 7000ppm in the past, and yet during that time the diversity of life was at a high. Not only that, but the current ice age began while co2 levels were pretty damned high, specially when you consider current levels. Co2 was at 5600ppm then, today we approach 400ppm.
I think the point that AGW proponents are trying to make is that the current rate of increase in CO2 levels is being termed as "unprecidented", meaning that CO2 levels are increasing at an alarming rate, aka: not normal.
But the problem with that claim is there is no way to measure historical rates of increase, all they can do is smooth the data over thousands of years due to lack of detailed source data.
So it's yet another AGW claim based on nothing but hyperbolic supposition.
You cannot claim something is out of the ordinary if there is no way to determine what 'normal' actually is. But for whatever reason, this particular branch of science seems to think that it can.
a reply to: CranialSponge
Traditionally, the scientific method presumes that one would formulate an hypothesis, then test it against measurable phenomena and if the test (model) cannot predict and match the measurable phenomena then one goes back to the drawing board and restate, adjust or otherwise alter the hypothesis and then see if it can predict accurately.
For whatever reason, the IPCC climate model has failed miserably in every verifiable application, and yet, it is continually referred to as if it is fact, rather than a failed hypothesis.
a reply to: network dude
My beef with global warming isn't the science, it's the proposed solution. If global warming can be fixed by taxing people more fiat currency, why not just print all the fiat currency we need to solve the problem?
If increased man-made CO2 emissions are a problem, the real solution is to stop or reduce CO2 emissions, not continue emitting CO2 at current levels and tax people.
a reply to: VictorVonDoom
That's just it, there is no workable solution that trumps insolation. None. It's ridiculous to suggest it as it would be to suggest an ant colony or multiple ant colonies would be able to build the Hoover damn.
That's just it, there is no workable solution that trumps insolation. None. It's ridiculous to suggest it as it would be to suggest an ant colony or multiple ant colonies would be able to build the Hoover damn.
a reply to: bbracken677
Please do not use charts that say "Present" with no definition as to what that is. You'll note that they do not define year 0 on your chart. You'll also note that CO2 levels are far below what they actually are now. The reason is because year 0 on that chart is circa 1850. Here's what that chart looks like with a date closer to present day:
Please do not use charts that say "Present" with no definition as to what that is. You'll note that they do not define year 0 on your chart. You'll also note that CO2 levels are far below what they actually are now. The reason is because year 0 on that chart is circa 1850. Here's what that chart looks like with a date closer to present day:
a reply to: Greven
You are right, in that the co2 levels were retrieved from ice cores from Antarctica.
I will look into why that chart was presented. I have seen a similar chart and other sources. You will note that when I talk about current co2 levels I refer to them as approaching 400ppm. Still does not affect my point.
Co2 levels at 400ppm are virtually irrelevant as relates to glacial growth and interglacial warming.
originally posted by: network dude
link
I guess I am a day late and a dollar short. The rest of the world decided, yet the data is still read both ways. Go figure
This article is utter garbage.
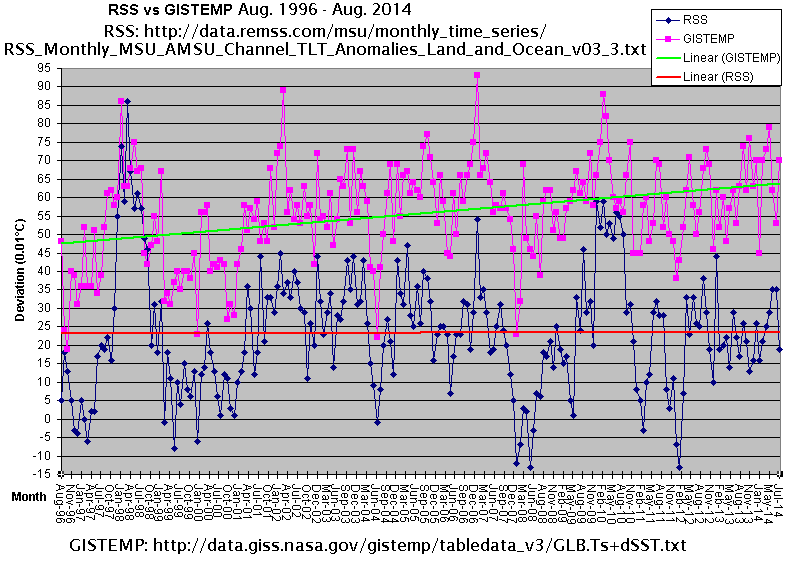
According to NASA satellites and all ground-based temperature measurements, global warming ceased in the late 1990s. This when CO2 levels have risen almost 10 percent since 1997. The post-1997 CO2 emissions represent an astonishing 30 percent of all human-related emissions since the Industrial Revolution began. That we’ve seen no warming contradicts all CO2-based climate models upon which global-warming concerns are founded.
GISTEMP = ground based, direct measurement of temperatures
RSS = satellite based, uncertain remote measurement of temperatures.
Rates of sea-level rise remain small and are even slowing, over recent decades averaging about 1 millimeter per year as measured by tide gauges and 2 to 3 mm/year as inferred from “adjusted” satellite data. Again, this is far less than what the alarmists suggested.
About 1mm/yr from gauges they say? 2-3mm/year, they say?
That's rather understating what even outspoken skeptics admit:
Which is right?: Sea level rise from tide gauges of 1.6 mm / year or satellite altimeters of 3.2 mm / year
Satellites also show that a greater area of Antarctic sea ice exists now than any time since space-based measurements began in 1979. In other words, the ice caps aren’t melting.
What nonsense is this? Yes, there is more sea ice in the southern hemisphere than before. No, increased sea ice extent doesn't mean the ice caps aren't melting. Sea ice is already in the ocean. It doesn't change anything but the albedo of the Earth. The global decline in land ice is terrifying:
The researchers, based at Germany's Alfred Wegener Institute Helmholtz Centre for Polar and Marine Research – used 200m data points across Antarctica and 14.3m across Greenland, all collected by CryoSat, to study how the ice sheets there had changed over the past three years. The satellite carries a high-precision altimeter, which sends out short radar pulses that bounce off the ice surface and then back to the satellite. By measuring the time this takes, the height of the ice beneath the spacecraft can be calculated.
It was found from the average drops in elevation that were detected by CryoSat that Greenland alone is losing about 90 cubic miles a year, while in Antarctica the annual volume loss is about 30 cubic miles. These rates of loss – described as "incredible" by one researcher – are the highest observed since altimetry satellite records began about 20 years ago, and they mean that the ice sheets' annual contribution to sea-level rise has doubled since 2009, say the researchers whose work was published in the journal Cryosphere last week.
Who are the people who wrote this factually inaccurate article?
Tom Harris is executive director of the Ottawa-based International Climate Science Coalition. Bob Carter is former professor and head of the School of Earth Sciences at James Cook University in Australia.
Tom Harris
Tom Harris is the Executive Director of the International Climate Science Coalition (ICSC), a group of climate change skeptics that has received funding from the Heartland Institute. Before starting work with ICSC, Harris was the Executive Director of the now-defunct Natural Resources Stewardship Project (NRSP).
Hmm... what was this NRSP thing:
A report in the Toronto Star on January 28, 2007 stated that the organization had not revealed who funds the Stewardship Project. The Guardian and Vancouver Sun stated in 2008 that the organization is funded by energy firms.
Bob Carter
In 2012, documents acquired from The Heartland Institute revealed that Carter was paid a monthly fee of $1,667 (USD), "as part of a program to pay 'high-profile individuals who regularly and publicly counter the alarmist [anthropogenic global warming] message'." While Carter did not deny that the payments took place, he declined to discuss the payments. Carter has denied that his scientific opinion on climate change can be bought.
Conclusion: crap article written by shills and published by a dumb place.
edit on 18Mon, 15 Sep 2014 18:05:00
-0500America/ChicagovAmerica/Chicago9 by Greven because: (no reason given)
a reply to: Greven
This paper illustrates how co2 levels have not been the drivers with regards to past periods of glacial growth or warming periods during interglacials. In fact, their research suggests the correlation to cosmic rays being a significant part of the equation, in addition to milankovitch cycles.
Source
This paper illustrates how co2 levels have not been the drivers with regards to past periods of glacial growth or warming periods during interglacials. In fact, their research suggests the correlation to cosmic rays being a significant part of the equation, in addition to milankovitch cycles.
There is another compelling argument that can be given to support this hypothesis. Sime, et al.16 have found that past interglacial climates were much warmer than previously thought. Their analysis of the data shows that the maximum interglacial temperatures over the past 340 kyr were between 6 oC and 10 oC above present day values. From Fig. 1, it can be seen that past interglacial carbon dioxide concentrations were not higher than that of the current interglacial, and therefore carbon dioxide could not have been responsible for this warming. In fact, the concentration of carbon dioxide that would be needed to produce a 6-10 oC rise in temperature above present day values exceeds the maximum (1000 p.p.m.v.) for the range of validity of the usual formula [∆F=α ln(C/C0)] used to calculate the forcing in response to such an increase.
Source
edit on 15-9-2014 by bbracken677 because: (no reason given)
a reply to: Greven
Your sources are crap, you know they are crap and this is why you present them.
You are arguing a strawman argument.
If you are going to argue the science, use legitimate sources such as academic papers and research. Otherwise it's just crap.
And by definition, crap post ... strawman argument. The internet is full of crap sources...you managed to find a decent number of them. I am sure if you try, you can find more.
Argue the science, ditch the strawman.
Your sources are crap, you know they are crap and this is why you present them.
You are arguing a strawman argument.
If you are going to argue the science, use legitimate sources such as academic papers and research. Otherwise it's just crap.
Conclusion: crap article written by shills and published by a dumb place.
And by definition, crap post ... strawman argument. The internet is full of crap sources...you managed to find a decent number of them. I am sure if you try, you can find more.
Argue the science, ditch the strawman.
edit on 15-9-2014 by bbracken677 because: (no reason given)
a reply to: Greven
Where did this quote come from?
Sure wasn't from the source you linked below it. You are using the Guardian for a supporting source? Really? lol
Satellites also show that a greater area of Antarctic sea ice exists now than any time since space-based measurements began in 1979. In other words, the ice caps aren’t melting.
Where did this quote come from?
Sure wasn't from the source you linked below it. You are using the Guardian for a supporting source? Really? lol
edit on 15-9-2014 by
bbracken677 because: (no reason given)
Here is another little tidbit, and I will use the co2 hysteria folks own numbers.
What is the single most significant greenhouse gas (GHG)?
Answer: Water vapor. Water vapor accounts for nearly 95% of the world's greenhouse effect.
Water Vapor is recognized as being in the area of 99.99% natural source.
This point is so crucial to the debate over global warming that how water vapor is or isn't factored into an analysis of Earth's greenhouse gases makes the difference between describing a significant human contribution to the greenhouse effect, or a negligible one.
Why is water vapor never part of the discussion with regards to the GHE (Greenhouse Effect)?
When one considers that the contributions of all GHGs with the exception of water vapor amounts to a whopping 5%, what is man's contribution to that?
When you put it all together, and factor in the contribution of water vapor, we see that man's contribution to the GHE is approximately 0.28% of the total GHE.
References:
source 1
source 2
source 3
edit on 15-9-2014 by bbracken677 because: (no reason given)
originally posted by: bbracken677
a reply to: Greven
Your sources are crap, you know they are crap and this is why you present them.
You are arguing a strawman argument.
If you are going to argue the science, use legitimate sources such as academic papers and research. Otherwise it's just crap.
Conclusion: crap article written by shills and published by a dumb place.
And by definition, crap post ... strawman argument. The internet is full of crap sources...you managed to find a decent number of them. I am sure if you try, you can find more.
Argue the science, ditch the strawman.
Oh really?
Will you be kind enough to demonstrate all of these allegations, or is it just talk?
a reply to: bbracken677
That is from the article cited, not the Guardian. The garbage NYPost article by anti-AGW shills is where that comes from and if you had read it you wouldn't have had to ask.
a reply to: Greven
The link immediately below the quote was from the guardian. Crap source.
You know this...the whole post was a disingenuous straw man argument.
I need demonstrate nothing...your post is the only indictment I need.
Argue the science, not crap websites using crap arguments.
You know better. I have seen you do much better.
Argue the science. Use legit sources.
edit on 15-9-2014 by bbracken677 because: (no reason given)
a reply to: bbracken677
A strawman is making up an argument and then destroying that fabricated argument. I did not do this, therefore I wanted you to demonstrate such an allegation.
The NYPost article had, if you would have read the article, a list of several things which I debunked. Without reading the article I critiqued, perhaps you could be confused by the presentation. I don't really understand your complaints.
The Guardian discusses its sources. People link to random blogs all of the time promoting skepticism of AGW - what's wrong with linking to a media source which summarizes much of the findings?
I'm not making this up - the CryoSat2 certainly found immense ice loss:
Using an astonishing 200 million data points across Antarctica and 14.3 million across Greenland collected by CryoSat, the team were able to study how the ice sheets changed over the three years.
The resulting maps reveal that Greenland alone is reducing in volume by about 375 cubic kilometres a year.
Antarctic ice-sheet change
The two ice sheets combined are thinning at a rate of 500 cubic kilometres a year, the highest rate observed since altimetry satellite records began about 20 years ago.
a reply to: network dude
If global warming is happening it's because of chemtrails!
Bahaw ! Bahaw ! Bahaw haw haw haw!
I can't stand myself.
SnF
If global warming is happening it's because of chemtrails!
Bahaw ! Bahaw ! Bahaw haw haw haw!
I can't stand myself.
SnF
edit on Rpm91514v522014u50 by randyvs because: (no reason given)
originally posted by: bbracken677
This point is so crucial to the debate over global warming that how water vapor is or isn't factored into an analysis of Earth's greenhouse gases makes the difference between describing a significant human contribution to the greenhouse effect, or a negligible one.
This is a curious statement... see, it's frequently elsewhere on the internet.
For example, This site which changes one single word:
This point is so crucial to the debate over global warming that whether water vapor is or isn't factored into an analysis of Earth's greenhouse gases makes the difference between describing a significant human contribution to the greenhouse effect, or a negligible one.
Of course, that site isn't particularly original either, as it links to this site:
This point is so crucial to the debate over global warming that how water vapor is or isn't factored into an analysis of Earth's greenhouse gases makes the difference between describing a significant human contribution to the greenhouse effect, or a negligible one.
Interesting, no? Searching around for this particular sentence yields a vast number of results... many attribute it to the original source, but a substantial number of others posting that statement do not. Quite fascinating, really!
The sources you list at the bottom are also from that Geocraft article. Two of them are identical in fact, as they appear to have been updated since that article was written and show the same information despite being on separate sites. It seems you did not notice this when copying the links. Anyway, this poses a bit of a problem, as one can no longer find the material the author links to in substantive statements - notably, the U.S. Department of Energy remarks.
Additionally, the author of that article makes some other curious statements (or maybe the Dept. of Energy did, can't really verify that now). For example, the pre-industrial atmospheric CO2 concentration was quite a bit lower than today:
This figure shows the atmospheric increase of CO2 over 280 ppm in weekly averages of CO2 observed at Mauna Loa. The value of 280 ppm is chosen as representative of pre-industrial air because it is close to the average of CO2 measured and dated with high time resolution between the years 1000 and 1800 in an ice core from Law Dome, Antarctica. [Etheridge et al., 1996]. Although the time resolution of old air locked in ice cores is not enough to preserve seasonal cycles, there is no doubt that the seasonal cycle, which is mostly caused by photosynthesis and respiration of ecosystems on land, was similar to what we observe today. Therefore, for the comparison with pre-industrial times the Mauna Loa weekly data have been first deseasonalized by subtracting the observed average seasonal cycle, and then subtracting 280 ppm.
What's it like today? Well, July is generally in the middle of the annual cycle, so it tends to get used as a rough benchmark:
Recent Global CO2
July 2014: 396.33 ppm
July 2013: 394.39 ppm
So, that's a difference between the pre-industrial CO2 concentration and today's CO2 concentration of 116 ppm. This is a pretty big change. The author claims the Dept. of Energy had the listing as follows:
CO2 (ppb)
Preindustrial: 288,000
Natural additions: 68,520
Manmade additions: 11,880
Total: 368,400
We emitted an estimated 36 gigatonnes of CO2 into the atmosphere in 2013. The Earth's atmosphere's mass is estimated at 5,148,000 gigatonnes. Let's use the 396.33ppm figure; CO2 weighs a bit more than other atmospheric components, so it has to be adjusted by multiplying the volume by the mass (1.5191), giving a total mass of 3,099 gigatonnes of CO2. Last year, the atmospheric concentration of CO2 was 392.39ppm, for a mass value of 3,068 gigatonnes of CO2. That's an additionally 31 gigatonnes over last year alone, or 3.94ppm (although that can be got a lot less complicated), so some CO2 is still leaving the atmosphere. Unfortunately, this calculation is much worse than the last time I did it, when there was only a rise of 18.83 gigatonnes a year over 7 years. I pray it does not accelerate.
Assuming the author's numbers to be accurate, the difference of ~27.93ppm from 14 years ago suggests a rise of merely 1.995ppm/yr. Yet, last year we nearly doubled that rate. That we are allegedly only responsible for a 11.88ppm increase seems rather silly, given the rate of our emissions. Yes, in the past it was lower - as was the total CO2 concentration in the atmosphere - but really now, we could surpass that sum in three years. Our emissions undoubtedly taking up space in the natural carbon sinks - hence, much of the 'natural CO2' that is accumulating is doing so as a result of our actions. To marginalize our contribution as that author (or the Dept. of Energy) does is to underestimate humanity's potential.
What does this all have to do with water vapor? Well, water vapor is indeed a greenhouse gas... but it tends to only stick around in the atmosphere for a few days, whereas most of the concerning greenhouse gasses can stick around for years or centuries. This makes it pretty responsive to temperature changes. It's not ignored:
“This new data set shows that as surface temperature increases, so does atmospheric humidity,” Dessler said. “Dumping greenhouse gases into the atmosphere makes the atmosphere more humid. And since water vapor is itself a greenhouse gas, the increase in humidity amplifies the warming from carbon dioxide."
Specifically, the team found that if Earth warms 1.8 degrees Fahrenheit, the associated increase in water vapor will trap an extra 2 Watts of energy per square meter (about 11 square feet).
"That number may not sound like much, but add up all of that energy over the entire Earth surface and you find that water vapor is trapping a lot of energy," Dessler said. "We now think the water vapor feedback is extraordinarily strong, capable of doubling the warming due to carbon dioxide."
Anyway, late and out of space
a reply to: Greven
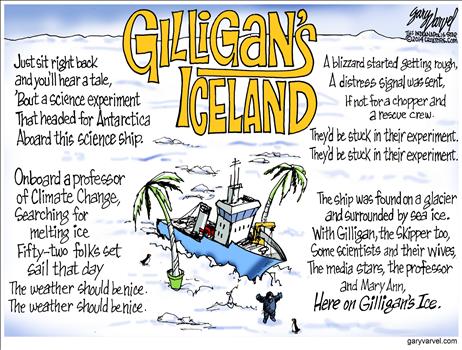
Hummmm, Excuse me,,,Greven, No, there's no,, it's all B S. You do remember these folks don't you?
LINKY
Hummmm, Excuse me,,,Greven, No, there's no,, it's all B S. You do remember these folks don't you?
In the runup to the Sept. 23 UN Climate Summit in New York, Leonardo DiCaprio is releasing a series of films about the “climate crisis.”
The first is “Carbon,” which tells us the world is threatened by a “carbon monster.” Coal, oil, natural gas and other carbon-based forms of energy are causing dangerous climate change and must be turned off as soon as possible, DiCaprio says.
DiCaprio is an actor, not a scientist; it’s no real surprise that his film is sensationalistic and error-riddled. Other climate-change fantasists, who do have a scientific background, have far less excuse.
Science is never settled, but the current state of “climate change” science is quite clear: There is essentially zero evidence that carbon dioxide from human activities is causing catastrophic climate change.
Yes, the “executive summary” of reports from the UN’s International Panel on Climate Change continues to sound the alarm — but the summary is written by the politicians. The scientific bulk of the report, while still tinged with improper advocacy, has all but thrown in the towel.
And the Nongovernmental International Panel on Climate Change lists thousands of scientific papers that either debunk or cast serious doubt on the supposed “consensus” model.
Oregon-based physicist Gordon Fulks sums it up well: “CO2 is said to be responsible for global warming that is not occurring, for accelerated sea-level rise that is not occurring, for net glacial and sea ice melt that is not occurring . . . and for increasing extreme weather that is not occurring.”
Consider:
According to NASA satellites and all ground-based temperature measurements, global warming ceased in the late 1990s. This when CO2 levels have risen almost 10 percent since 1997. The post-1997 CO2 emissions represent an astonishing 30 percent of all human-related emissions since the Industrial Revolution began. That we’ve seen no warming contradicts all CO2-based climate models upon which global-warming concerns are founded.
Rates of sea-level rise remain small and are even slowing, over recent decades averaging about 1 millimeter per year as measured by tide gauges and 2 to 3 mm/year as inferred from “adjusted” satellite data. Again, this is far less than what the alarmists suggested.
Satellites also show that a greater area of Antarctic sea ice exists now than any time since space-based measurements began in 1979. In other words, the ice caps aren’t melting.
A 2012 IPCC report concluded that there has been no significant increase in either the frequency or intensity of extreme weather events in the modern era. The NIPCC 2013 report concluded the same. Yes, Hurricane Sandy was devastating — but it’s not part of any new trend.
LINKY
a reply to: Greven
The link in the statement regarding pre-inductrial co2 concentration takes on to Mauna Loa co2 ..
I would like to point out that correlation does not equal causation. As temperatures rise, co2 is released from the ocean. As temperatures drop, co2 is stored in the ocean. This is one of the reasons that at the end of glacial growth that co2 level increases typically lag behind temperature increases by 800-1000 years.
Additionally, the author of that article makes some other curious statements (or maybe the Dept. of Energy did, can't really verify that now). For example, the pre-industrial atmospheric CO2 concentration was quite a bit lower than today:
The link in the statement regarding pre-inductrial co2 concentration takes on to Mauna Loa co2 ..
I would like to point out that correlation does not equal causation. As temperatures rise, co2 is released from the ocean. As temperatures drop, co2 is stored in the ocean. This is one of the reasons that at the end of glacial growth that co2 level increases typically lag behind temperature increases by 800-1000 years.
new topics
-
Denmark's Notre-Dame moment - 17th Century Borsen goes up in Flames
Mainstream News: 57 minutes ago -
We need less laws in the UK not more
General Chit Chat: 3 hours ago -
The Baloney aka BS Detection Kit
Social Issues and Civil Unrest: 8 hours ago -
Suspected Iranian agent working for Pentagon while U.S. coordinated defense of Israel
US Political Madness: 8 hours ago -
How does my computer know
Education and Media: 11 hours ago
top topics
-
Suspected Iranian agent working for Pentagon while U.S. coordinated defense of Israel
US Political Madness: 8 hours ago, 15 flags -
USO 10 miles west of caladesi island, Clearwater beach Florida
Aliens and UFOs: 16 hours ago, 9 flags -
The Baloney aka BS Detection Kit
Social Issues and Civil Unrest: 8 hours ago, 6 flags -
We need less laws in the UK not more
General Chit Chat: 3 hours ago, 4 flags -
How does my computer know
Education and Media: 11 hours ago, 3 flags -
Denmark's Notre-Dame moment - 17th Century Borsen goes up in Flames
Mainstream News: 57 minutes ago, 3 flags
active topics
-
Running Through Idiot Protestors Who Block The Road
Rant • 64 • : YourFaceAgain -
Putin Compares Himself to Jesus Promoting Traditional Values Against the Satanic West
Mainstream News • 69 • : whereislogic -
-@TH3WH17ERABB17- -Q- ---TIME TO SHOW THE WORLD--- -Part- --44--
Dissecting Disinformation • 480 • : Thoughtful3 -
DWAC Trumps Truth social stock soars .
Mainstream News • 113 • : Kaiju666 -
Candidate TRUMP Now Has Crazy Judge JUAN MERCHAN After Him - The Stormy Daniels Hush-Money Case.
Political Conspiracies • 197 • : Annee -
Are the 'Abrahamic Religions' all Really the Worshipping the Same Abrahamic God?
Conspiracies in Religions • 178 • : Coelacanth55 -
Denmark's Notre-Dame moment - 17th Century Borsen goes up in Flames
Mainstream News • 3 • : dothedew -
We need less laws in the UK not more
General Chit Chat • 5 • : Hakaiju -
NYAG Letitia James Prepares to Begin Seizing TRUMP Assets Even Though There Was No Crime.
Above Politics • 280 • : Annee -
It has begun... Iran begins attack on Israel, launches tons of drones towards the country
World War Three • 648 • : YourFaceAgain