It looks like you're using an Ad Blocker.
Please white-list or disable AboveTopSecret.com in your ad-blocking tool.
Thank you.
Some features of ATS will be disabled while you continue to use an ad-blocker.

Don't believe the world is warming? Fever Rising will convince you!
page: 4share:
a reply to: Rezlooper
This is a book I will definitely get. Not because I am a Global Warming believer, but rather some one that does believe in climate change, well, because it always does.
But I have believed that Methane has always been a threat that was if not recognized, then actively downplayed. I look forward to reading it.
I have a feeling that math plays a large part in this book. I hate math!
a reply to: Rezlooper
In going over your post, and what I responded, I see that I did not fully answer one of your questions.
I do believe there will be higher temps in store for us, based on current overall trends as well as what happened during previous interglacials. However, once a peak (what will the peak be? Good question.. No one knows that one, not having a crystal ball) is reached the temps will rapidly begin to drop, regardless of what levels GHG are at, again based on previous interglacials.
The above is an opinion, true, but one based on science and facts. The cycles are well established and conditions still exist that favor glaciation.
What conditions you ask? For one, the existence of a continuous mass from north to South Pole, disrupting the major currents that previously (pre ice age) distributed heat more efficiently than is currently happening.
Another condition is the current astronomic cycles, which existed before but were not aided by the disruption of equatorial ocean currents by the presence of land masses.
Since the land masses have not changed and since the earth is still moving in the identical fashion it has for millions of years, the conditions still exist for glaciation.
a reply to: Rezlooper
lol so all the science meant nothing to you? Interesting.
What do you have to say about the Milankovitch cycles and glaciation?
You answered rather quickly, so I sincerely doubt you followed the links. I would even question that you actually read and understood half what I wrote.
I am pretty disappointed that is all you took away from all that. But then, this is ATS. Tin foil hats abound.
edit on 12-9-2014 by bbracken677 because: (no reason given)
a reply to: Rezlooper
We had a small spat of flurries here in Ohio today (Cleveland area). And last year we had a blizzard in mid-October. Could the methane seepage combined with a El-Nina event cause this?
Winter seems to be arriving earlier every year here...which kind of flys in the face of the Global Warming crowd.
We had a small spat of flurries here in Ohio today (Cleveland area). And last year we had a blizzard in mid-October. Could the methane seepage combined with a El-Nina event cause this?
Winter seems to be arriving earlier every year here...which kind of flys in the face of the Global Warming crowd.
a reply to: bbracken677
Please look at the question I posed Rez.
I find this subject eerily fascinating.
Please look at the question I posed Rez.
I find this subject eerily fascinating.
a reply to: TDawgRex
You cannot really take short term variations to mean anything. There is weather and there is climate.
We will see global temps begin to drop over a period of years before conclusions can be drawn.
Personally I think we have another few hundred years, perhaps a thousand before we have to worry about glaciation.
a reply to: Rezlooper
Look at this graph and tell me what you think?
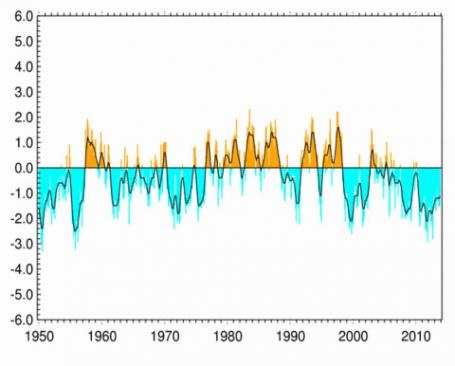
This graph shows the Pacific Decadal Oscillation, which tends to alternate between positive (warm, shown in yellow above) and negative (cool, shown in blue) phases every 20 to 30 years. Cool conditions have predominated since about 1998. (NCDC)
I forgot to include the description
Look at this graph and tell me what you think?
This graph shows the Pacific Decadal Oscillation, which tends to alternate between positive (warm, shown in yellow above) and negative (cool, shown in blue) phases every 20 to 30 years. Cool conditions have predominated since about 1998. (NCDC)
I forgot to include the description
edit on 12-9-2014 by bbracken677 because: (no reason given)
This is why I state that global temps have not risen during the last 17 years (I may have stated 15)
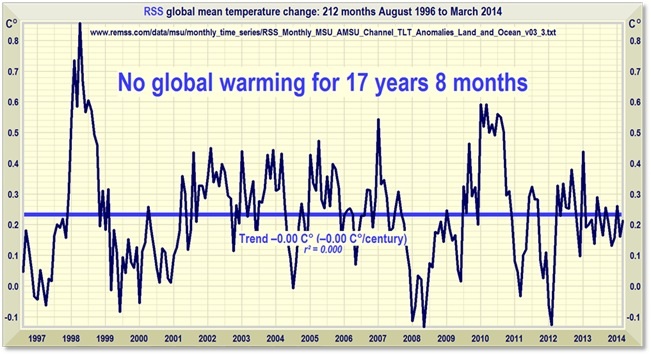
In fact, the 4 year trend is downwards. Which explains the increase in Arctic Ice.
Not that I think the downward trend will continue.
In fact, the 4 year trend is downwards. Which explains the increase in Arctic Ice.
Not that I think the downward trend will continue.
edit on 12-9-2014 by bbracken677 because: (no reason given)
edit on 12-9-2014 by bbracken677 because: (no reason
given)
a reply to: bbracken677
It seems to me that the graph reflects El Nino and El Nina events. Granted, I'm just an observer and can't quantify my opinions. But I think that methane, combined with both natural and man-made pollutants can have a effect.
It's just not one thing in other words causing all this. But rather one thing can have cumulative effects upon other things.
The Pacific is deep and has always ran on the colder side of temps because of that. The Atlantic however is shallower and I can see the Methane frost at the bottom defrosting quicker due to current changes.
I think that this is something we must seriously look at.
originally posted by: bbracken677
a reply to: Rezlooper
Look at this graph and tell me what you think?
This graph shows the Pacific Decadal Oscillation, which tends to alternate between positive (warm, shown in yellow above) and negative (cool, shown in blue) phases every 20 to 30 years. Cool conditions have predominated since about 1998. (NCDC)
I forgot to include the description
this graph where are the readings taken from ?...is it like one location or is a graph for an average of the entire planet ?
a reply to: TDawgRex
Methane is the one thing that does not fit all the patterns, and as I stated in a previous post, it is the one thing that concerns me.
Given that temps in previous interglacials were higher than today, what makes this period different? Man is the only common denominator.
On the other hand, I have shown and can show more regarding how GHG's do not have the impact they are being represented as having. Rezlooper has shown how man is contributing, but at the same time one has to admit that unless a lot of new methane has been created since the last interglacial then something is funny. Most of the methane is coming from natural sources.
At 2.571 ppm and 400 ppm methane and co2 levels are still but a very small percentage of the makeup of our atmosphere... Consider that all the other gases, which are predominantly nitrogen, oxygen and argon, make up the roughly 999,597 ppm that is the balance.
Consider that glaciation has begun with co2 levels at multiple times our current level. I am not impressed with the GHG doom porn.
edit on
12-9-2014 by bbracken677 because: (no reason given)
a reply to: hopenotfeariswhatweneed
Honestly, I do not know. The graph is from the NCDC (National Climatic Data Center).
Honestly, I do not know. The graph is from the NCDC (National Climatic Data Center).
a reply to: hopenotfeariswhatweneed
The Pacific Decadal Oscillation (PDO) is often described as a long-lived El Niño-like pattern of Pacific climate variability (Zhang et al. 1997). As seen with the better-known El Niño/Southern Oscillation (ENSO), extremes in the PDO pattern are marked by widespread variations in the Pacific Basin and the North American climate. In parallel with the ENSO phenomenon, the extreme phases of the PDO have been classified as being either warm or cool, as defined by ocean temperature anomalies in the northeast and tropical Pacific Ocean. When SSTs are anomalously cool in the interior North Pacific and warm along the Pacific Coast, and when sea level pressures are below average over the North Pacific, the PDO has a positive value. When the climate anomaly patterns are reversed, with warm SST anomalies in the interior and cool SST anomalies along the North American coast, or above average sea level pressures over the North Pacific, the PDO has a negative value (Courtesy of Mantua, 1999)
a reply to: bbracken677
ok cheers.....i take it from what you quoted we can assume they are using the pacific ocean for their data....i would like to see a world average and not just from a specific location i suspect we would see much different results
ok cheers.....i take it from what you quoted we can assume they are using the pacific ocean for their data....i would like to see a world average and not just from a specific location i suspect we would see much different results
a reply to: hopenotfeariswhatweneed
Of course we would.
I would suggest that you read through the last few pages. Tons of data presented.
Then let me know what you think, please
oh and sorry, I misunderstood your previous question. I thought you were asking specifically where they were taking their readings.
Of course we would.
I would suggest that you read through the last few pages. Tons of data presented.
Then let me know what you think, please
oh and sorry, I misunderstood your previous question. I thought you were asking specifically where they were taking their readings.
edit on 12-9-2014 by bbracken677 because: (no reason given)
a reply to: bbracken677
i am interested in this kind of thing i will have a look later on this evening after i have put the young fella to bed
I would suggest that you read through the last few pages. Tons of data presented. Then let me know what you think, please
i am interested in this kind of thing i will have a look later on this evening after i have put the young fella to bed
Aside from promoting awareness of the subject, what good is any attempt to convince other people of global warming? If nothing can be done about it,
it just seems to me that it's negative nancys who want to bring everyone down - not with doom, but with gloom.
originally posted by: bbracken677
a reply to: TDawgRex
Methane is the one thing that does not fit all the patterns, and as I stated in a previous post, it is the one thing that concerns me.
Given that temps in previous interglacials were higher than today, what makes this period different? Man is the only common denominator.
On the other hand, I have shown and can show more regarding how GHG's do not have the impact they are being represented as having. Rezlooper has shown how man is contributing, but at the same time one has to admit that unless a lot of new methane has been created since the last interglacial then something is funny. Most of the methane is coming from natural sources.
At 2.571 ppm and 400 ppm methane and co2 levels are still but a very small percentage of the makeup of our atmosphere... Consider that all the other gases, which are predominantly nitrogen, oxygen and argon, make up the roughly 999,597 ppm that is the balance.
Consider that glaciation has begun with co2 levels at multiple times our current level. I am not impressed with the GHG doom porn.
You keep pointing out how insignificant these levels of methane and carbon are, but the point is, those measly levels are enough to take things out of balance. Those levels of methane are enough to trap the sun's heat like a blanket over the planet. The sun's long wave infrared comes in, heats the surface, and then bounces out as short wave infrared...normally. But, the levels of methane we are seeing are preventing all that short wave infrared from escaping, causing global temperatures to rise. One thing here...I agree with you that all this extra methane, well not all, but nearly all of it is coming from natural sources such as the hydrates, melting permafrost, wetlands, and volcanoes. But, IMO, we have to add to that list Fracking. There is more fugitive methane from frack wells than previously anticipated and even the EPA is admitting that they had the numbers wrong before this year.
a reply to: BasementWarriorKryptonite
In a nutshell, there are people like Al Gore who have millions invested in green industry, not to mention those who take govt money, produce zero products and then declare bankruptcy coming out of the experience filthy rich.
These people will make billions if people become hysterical about it.
There is nothing we can do about it anymore than we can control ocean currents or hurricanes. Those would be much simpler than stopping climate change.
As little as we understand about climate change, we would more likely screw the pooch.
new topics
-
I hate dreaming
Rant: 17 minutes ago -
Is the origin for the Eye of Horus the pineal gland?
Philosophy and Metaphysics: 2 hours ago -
Man sets himself on fire outside Donald Trump trial
Mainstream News: 2 hours ago -
Biden says little kids flip him the bird all the time.
2024 Elections: 2 hours ago -
The Democrats Take Control the House - Look what happened while you were sleeping
US Political Madness: 2 hours ago -
Sheetz facing racial discrimination lawsuit for considering criminal history in hiring
Social Issues and Civil Unrest: 3 hours ago -
In an Historic First, In N Out Burger Permanently Closes a Location
Mainstream News: 4 hours ago -
MH370 Again....
Disaster Conspiracies: 5 hours ago -
Are you ready for the return of Jesus Christ? Have you been cleansed by His blood?
Religion, Faith, And Theology: 7 hours ago -
Chronological time line of open source information
History: 9 hours ago
top topics
-
In an Historic First, In N Out Burger Permanently Closes a Location
Mainstream News: 4 hours ago, 14 flags -
The Democrats Take Control the House - Look what happened while you were sleeping
US Political Madness: 2 hours ago, 9 flags -
Thousands Of Young Ukrainian Men Trying To Flee The Country To Avoid Conscription And The War
Other Current Events: 15 hours ago, 8 flags -
A man of the people
Medical Issues & Conspiracies: 10 hours ago, 8 flags -
Man sets himself on fire outside Donald Trump trial
Mainstream News: 2 hours ago, 7 flags -
Biden says little kids flip him the bird all the time.
2024 Elections: 2 hours ago, 6 flags -
4 plans of US elites to defeat Russia
New World Order: 12 hours ago, 4 flags -
Are you ready for the return of Jesus Christ? Have you been cleansed by His blood?
Religion, Faith, And Theology: 7 hours ago, 3 flags -
Is the origin for the Eye of Horus the pineal gland?
Philosophy and Metaphysics: 2 hours ago, 3 flags -
Sheetz facing racial discrimination lawsuit for considering criminal history in hiring
Social Issues and Civil Unrest: 3 hours ago, 3 flags
active topics
-
Post A Funny (T&C Friendly) Pic Part IV: The LOL awakens!
General Chit Chat • 7126 • : imitator -
Man sets himself on fire outside Donald Trump trial
Mainstream News • 21 • : caterpillage -
Biden says little kids flip him the bird all the time.
2024 Elections • 10 • : imitator -
I hate dreaming
Rant • 1 • : nugget1 -
Thousands Of Young Ukrainian Men Trying To Flee The Country To Avoid Conscription And The War
Other Current Events • 28 • : Xtrozero -
12 jurors selected in Trump criminal trial
US Political Madness • 89 • : ImagoDei -
Is the origin for the Eye of Horus the pineal gland?
Philosophy and Metaphysics • 4 • : JoelSnape -
Fossils in Greece Suggest Human Ancestors Evolved in Europe, Not Africa
Origins and Creationism • 72 • : Xtrozero -
MH370 Again....
Disaster Conspiracies • 8 • : Lazy88 -
Do we live in a simulation similar to The Matrix 1999?
ATS Skunk Works • 27 • : purplemer