It looks like you're using an Ad Blocker.
Please white-list or disable AboveTopSecret.com in your ad-blocking tool.
Thank you.
Some features of ATS will be disabled while you continue to use an ad-blocker.

Ebola - my visual charts & projections based on WHO data
page: 7share:
Here is a recent study discussing the R0 for the current outbreak:
Estimating the reproduction number of Zaire ebolavirus (EBOV) during the 2014 outbreak in West Africa
This iterates again how important it is to affect the basic reproduction number of this diesease, and soon.
The best-fit estimates of the basic reproduction number are 1.52 for Guinea, 2.42 for Sierra Leone and 1.65 for Liberia. The model shows that control efforts in Guinea and Sierra Leone were successful in reducing the effective reproduction number below unity by the end of May and July 2014, respectively. In Liberia, however, the model estimates an effective reproduction number of around 1.5 in mid-August 2014. This suggests that control efforts in Liberia need to be improved substantially in order to stop the current outbreak.
Estimating the reproduction number of Zaire ebolavirus (EBOV) during the 2014 outbreak in West Africa
This iterates again how important it is to affect the basic reproduction number of this diesease, and soon.

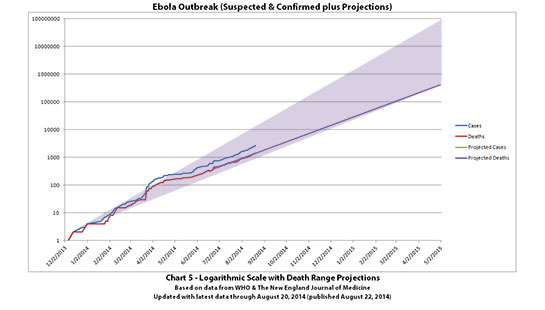
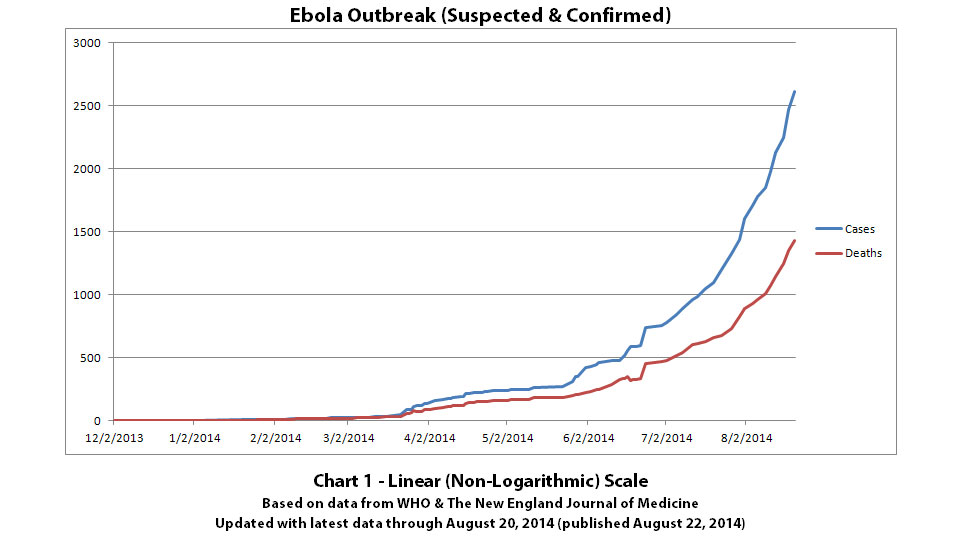
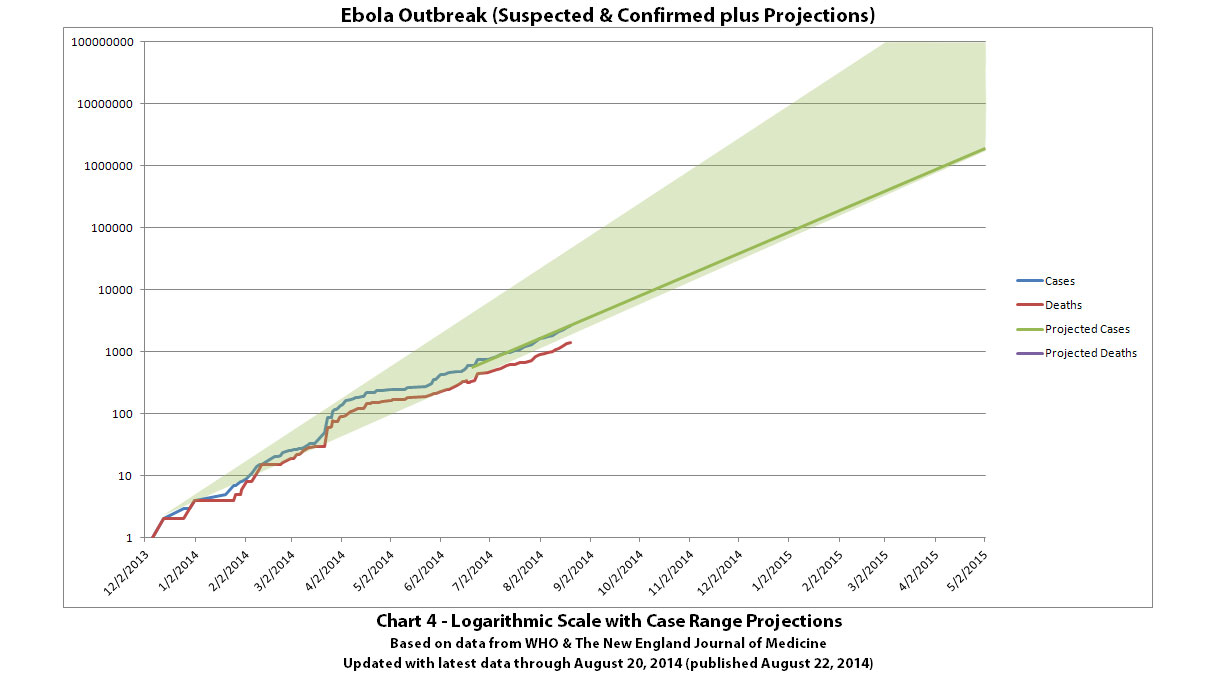
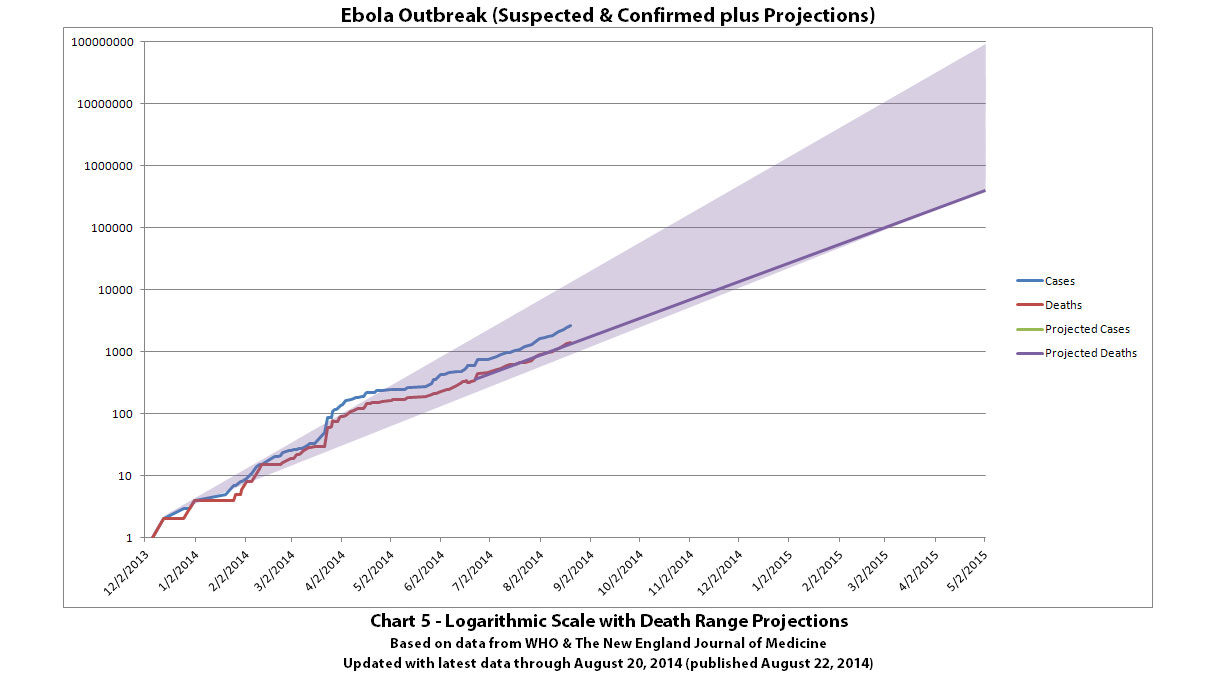
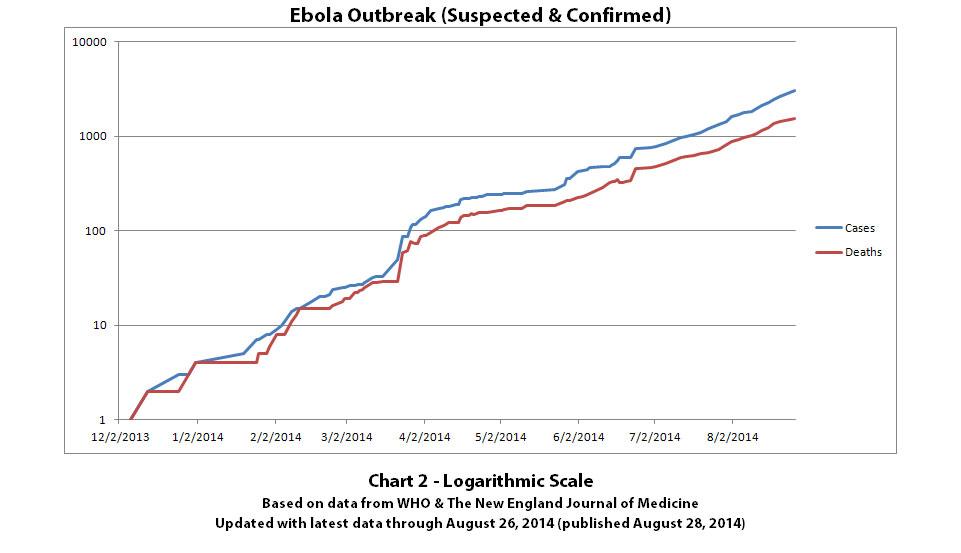
I updated the Ebola outbreak charts to include the latest update from the World Health Organization (WHO) that was published on August 22, 2014
(covering through August 20, 2014).
This is a more comprehensive update than previous updates. I went back through all 'official' data that is publicly available and filled in every known data point for every possible date - more of the 'in-betweens.' The most recent previous updates used data points for 74 different dates. The new charts use data points for 106 different dates. That gives 43% better resolution to the curves. More details on this are included below the charts for those interested.
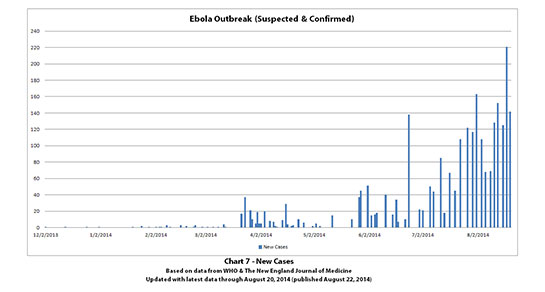
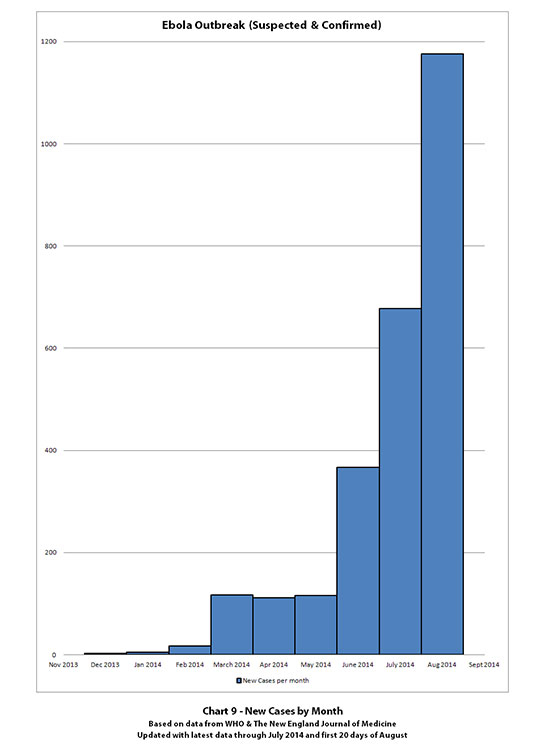
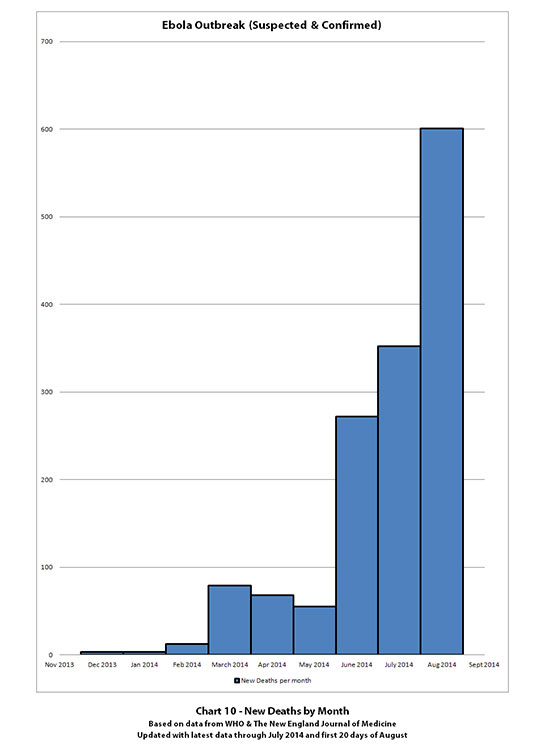
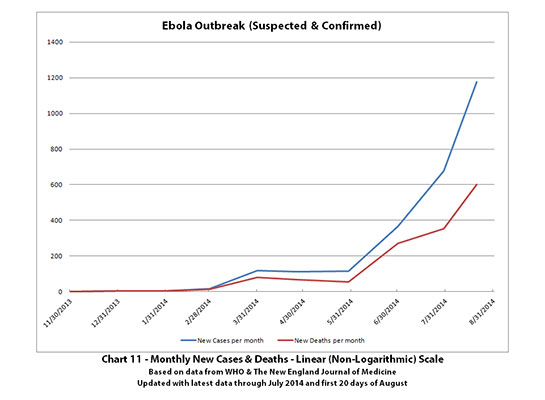
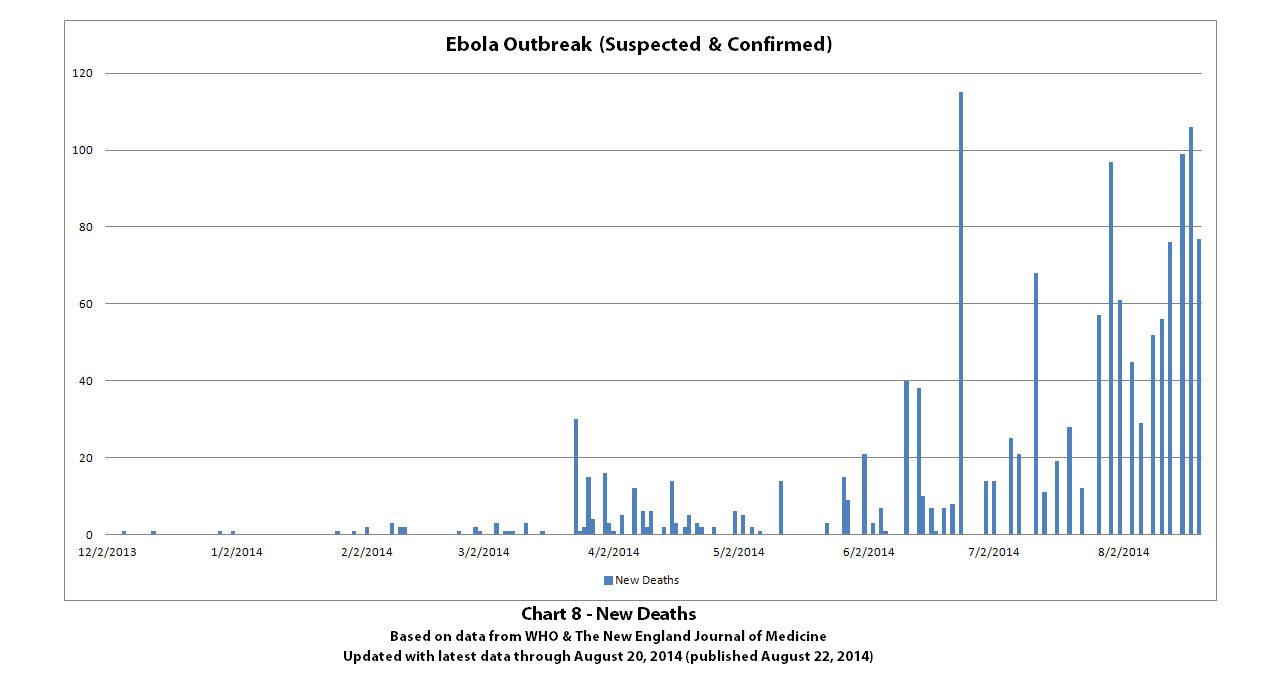
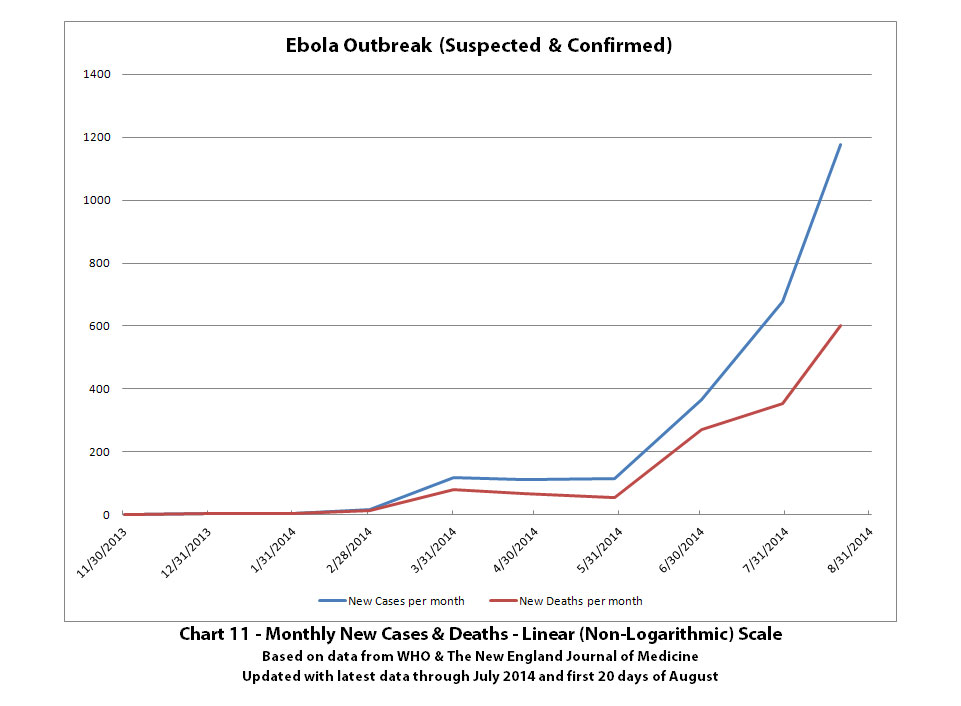
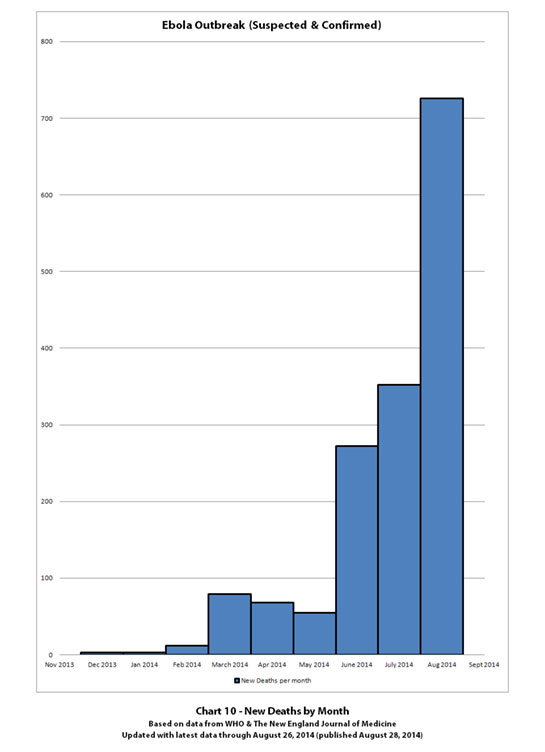
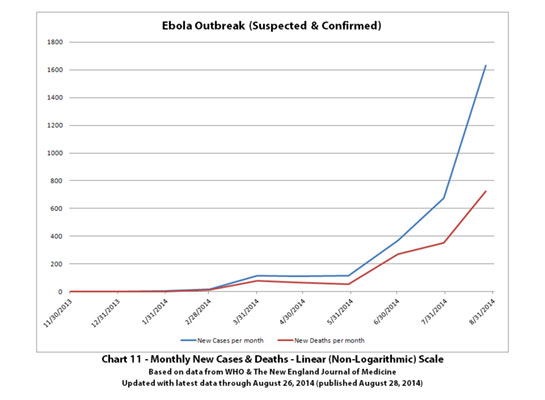
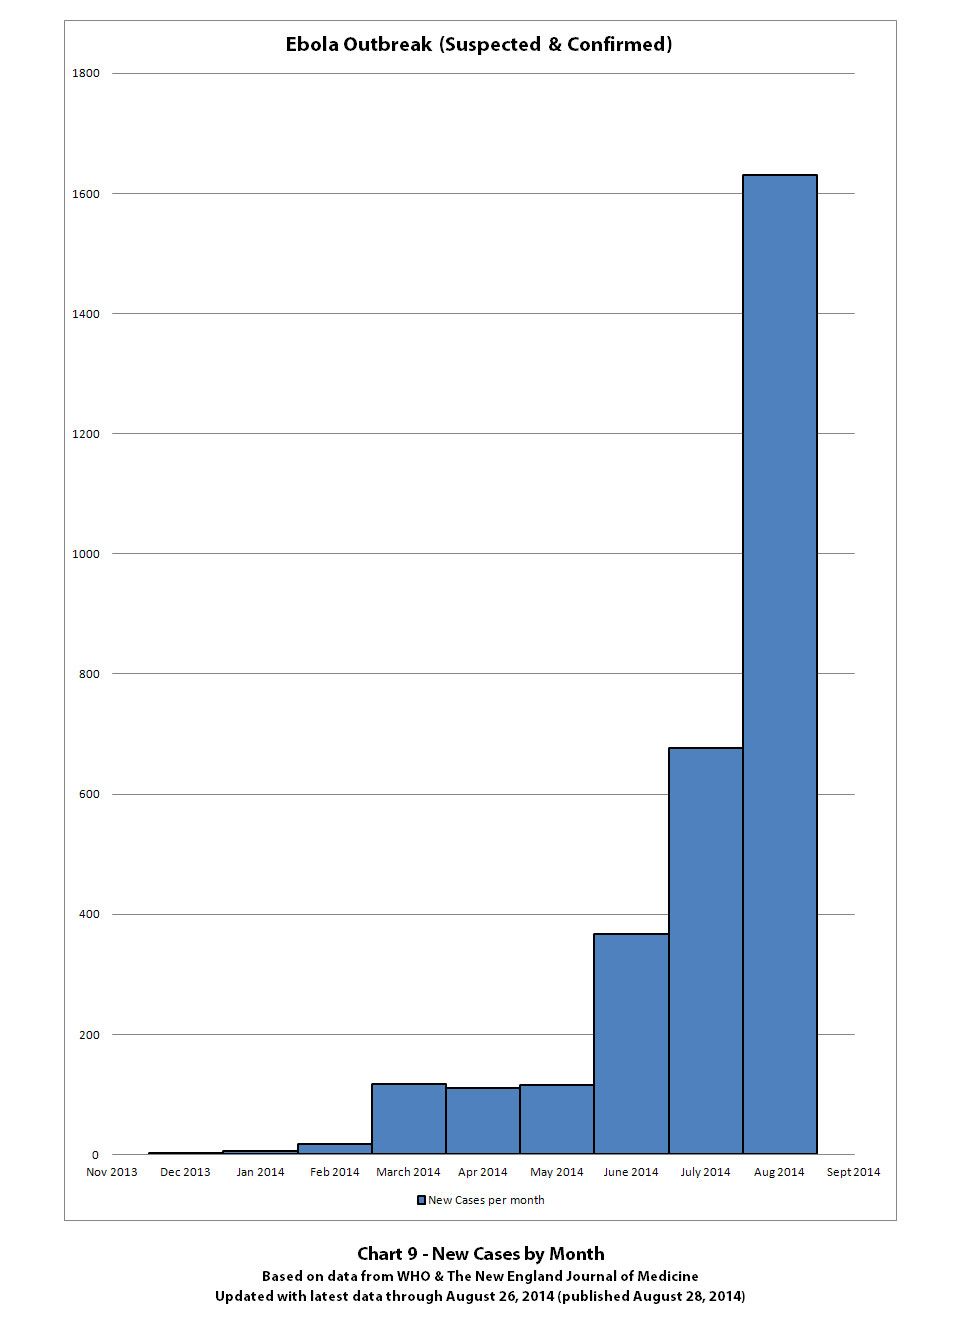
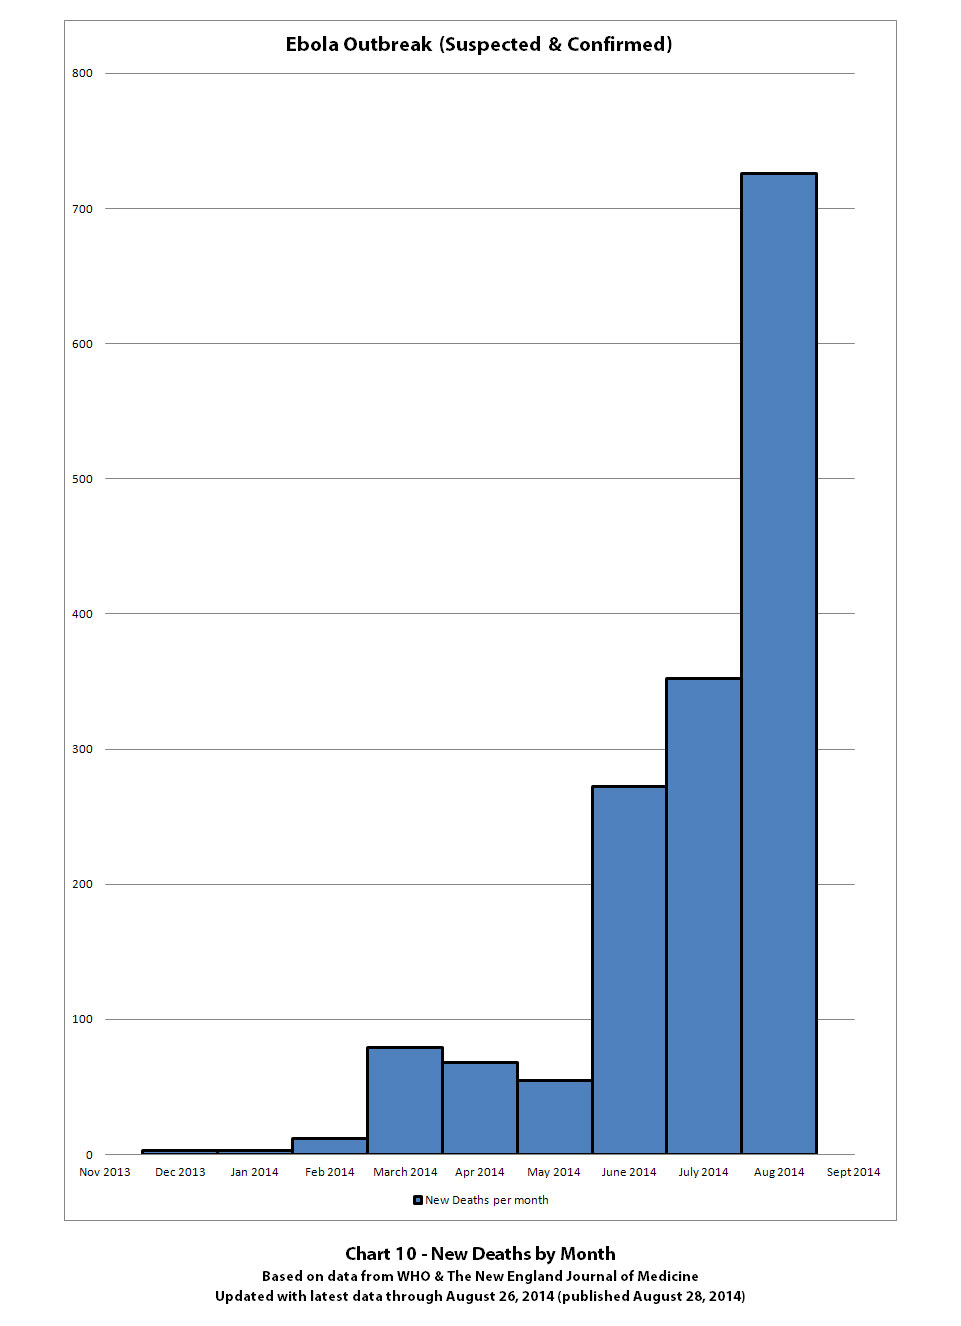
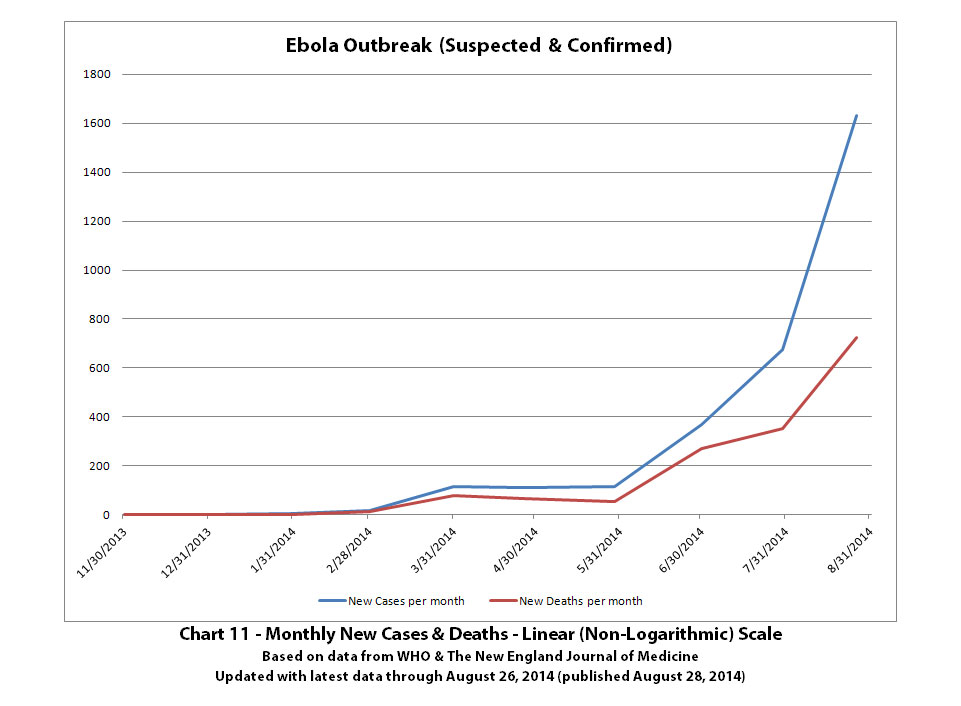
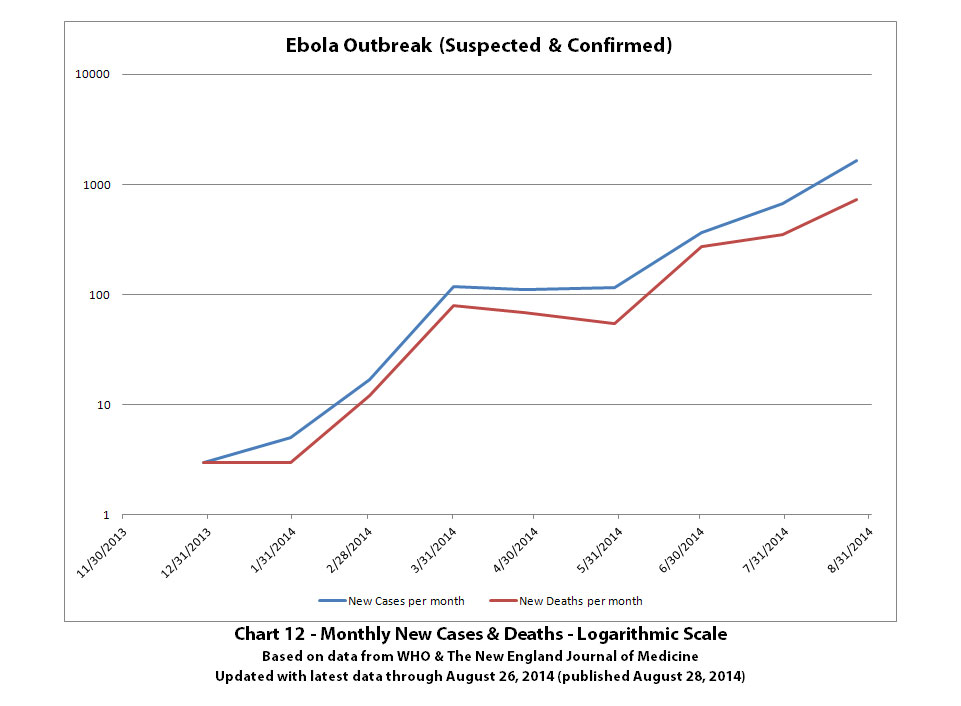
There are also more new charts that show the number of new Ebola cases or deaths per month. Click any graphic below to see it larger.
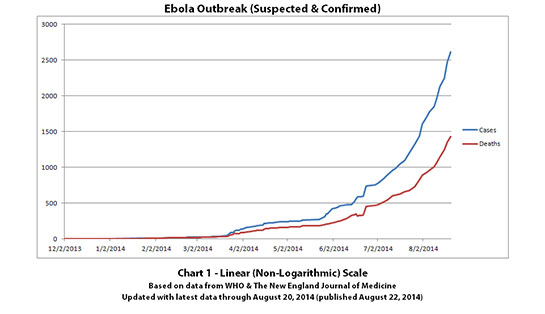


Charts and future projections were done by me, not by WHO. I am not an Ebola expert, epidemiologist, virologist, or MD, but I manually compiled the data used to create these graphs from news updates on the following WHO and New England Journal of Medicine websites:
SOURCE: WHO website 1
SOURCE: WHO website 2
SOURCE: WHO website 3
SOURCE: The New England Journal of Medicine
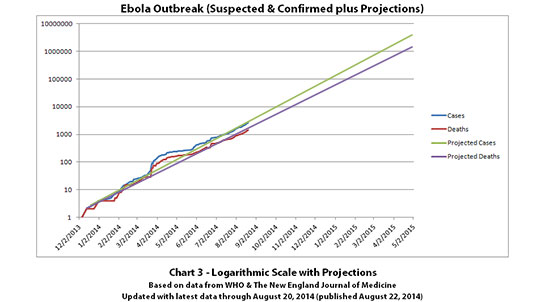
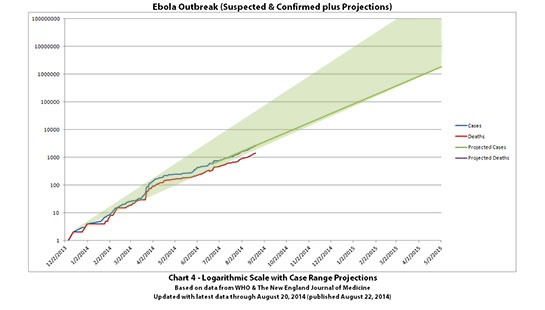
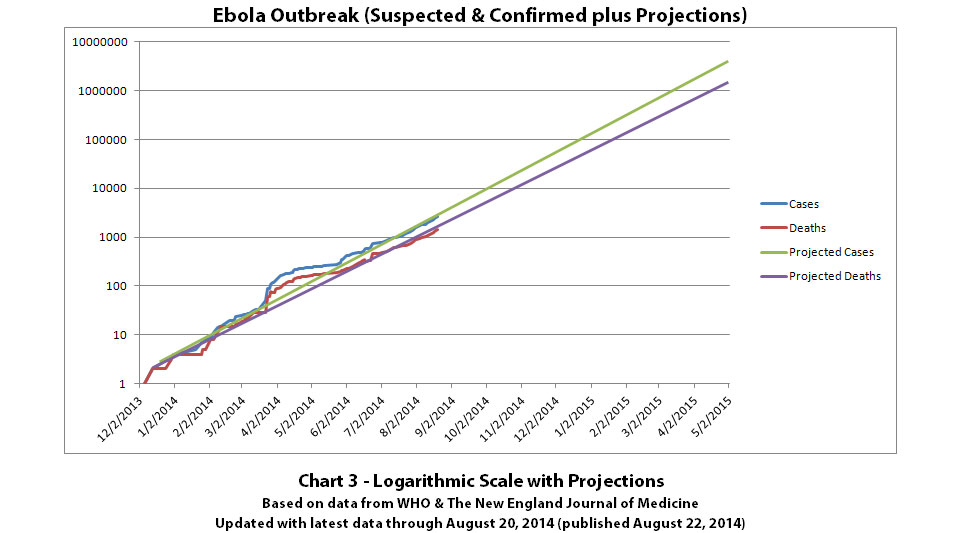
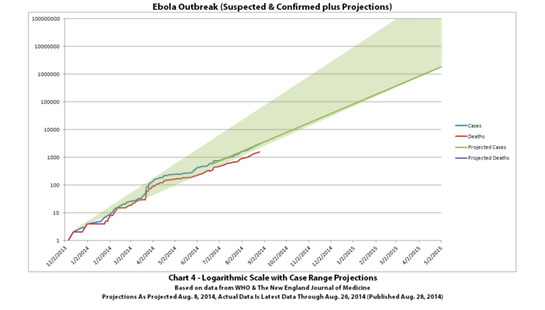
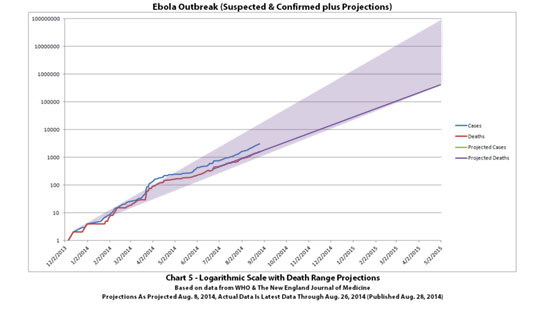
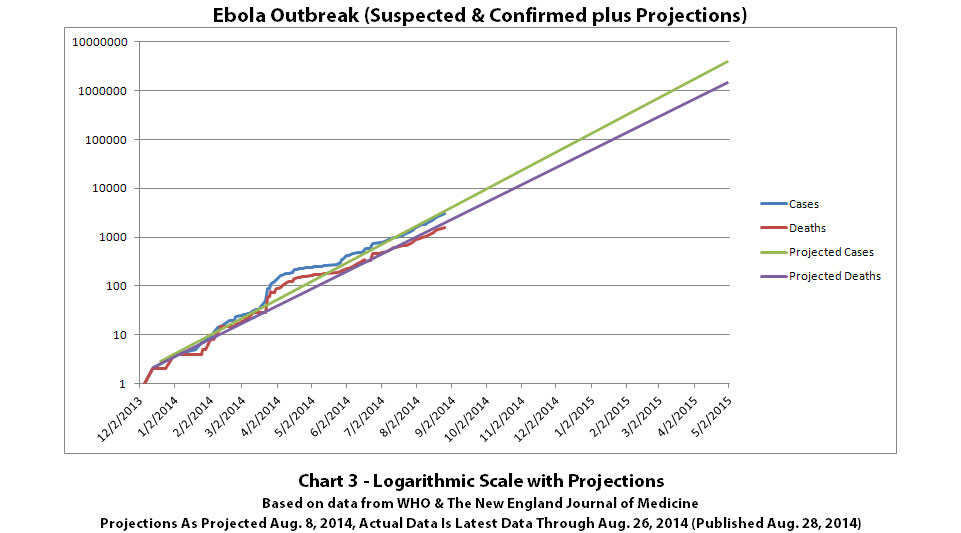
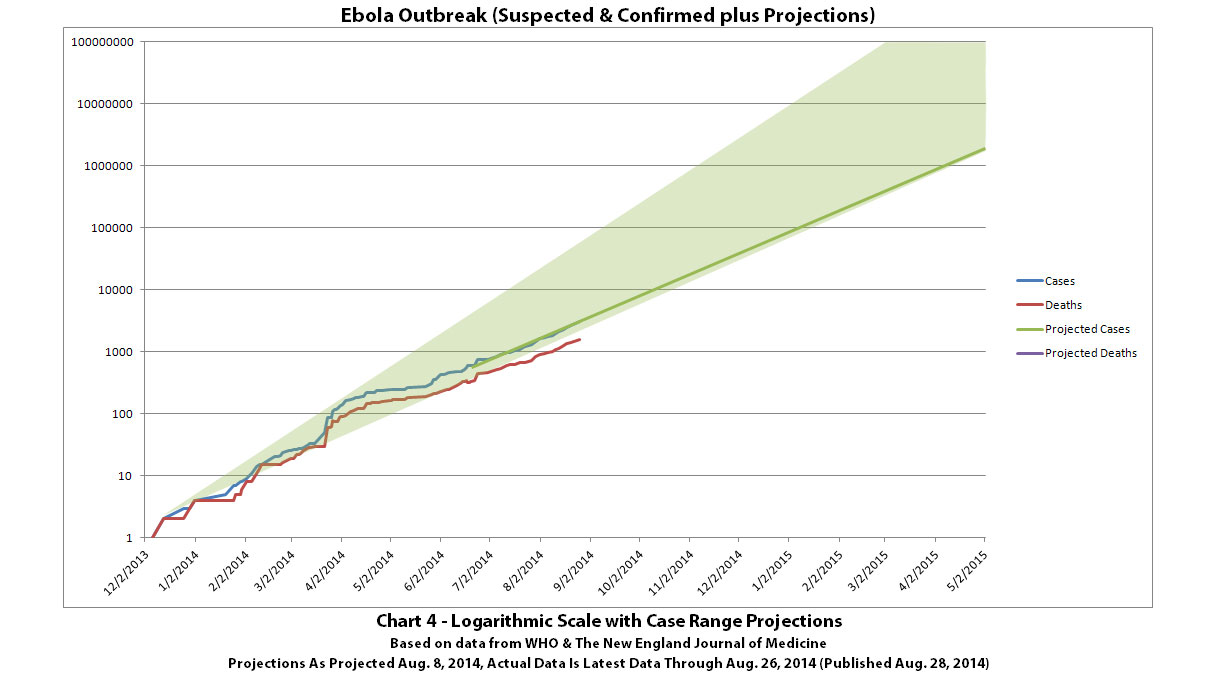
In Charts 3-5, I updated the latest known numbers but left the projection lines and shaded areas the same as on August 8, 2014 so that it will be obvious if the actual numbers start to deviate much from the projections. Please do not do anything you might regret based on projections. Efforts to contain, quarantine, treat, prevent, or cure Ebola will hopefully prove them wrong.
Additional info regarding this comprehensive update:
When I created the first charts, I only created charts for total numbers of cases and deaths and some of my own possible future projections based on this data. Since it was very time consuming to compile the data and since I only needed enough data points to graph the curves of the total increases, I didn't include every single update from WHO in the data for the first charts.
Later, I added additional graphs, often at the request of other ATS members. It became obvious that it would be better to have all known data in the data tables that create the graphs. That would allow me to display the data in higher detail and in a greater variety of ways.
Honestly, I was hoping by now it would be a moot point, that the outbreak would somehow be controlled by now and the projections would not be fulfilled. So far the outbreak continues. Over the last four days, I spent some spare time going back through ALL of the data regarding the earliest known cases from The New England Journal of Medicine as well as all outbreak news updates released by WHO from the time they first began covering this outbreak through their latest update. I went through all of these updates in great detail, redoing my data tables and filling in every single data point as accurately as possible, and even by country as well as totals.
This is actually not too easy. Prior to WHO's July 1, 2014 update, the WHO data was not presented in standardized tables and the data in the updates often doesn't quite add up along with previous or later updates. New updates often corrected old data with newer information plus added new data. For example, if a past update stated there were 100 cases but a later update might rule out 20 cases as not being Ebola but might add 10 new cases. This complicates the ability to compile correct data over time and affects the accuracy of the graph curves.
I tried to stick as closely as possible to the numbers reported by WHO. But where it was obvious that changes in known data occurred and were large enough to affect the curves, I tried to correct the past data in my data tables. For example if previous data indicated there were 100 cases in a country but new data ruled out 70 cases as not being Ebola, I corrected the past data so that the charts would more accurately reflect real data.
In general, I only made such corrections where they were obvious and were large enough to significantly affect the graph curves. I didn't correct every single instance of this. It would take a huge amount of time and small differences would not noticeably affect the graph curves. It's also quite obvious that WHO's data is not accurate enough to be so certain of exact numbers at any point.
These charts are based on the most accurate data currently publicly available. But as with any data, you should assume there is (at least) an implied limitation of +/- some small error percentage. It's also worth noting that even WHO believes the number of cases and deaths are drastically under-reported by the countries experiencing the outbreak(s). One of the charitable organizations that has provided medical assistance during the outbreak(s), Samaritan's Purse, estimated that only 25% of actual cases and deaths in this outbreak may be reported.
This is a more comprehensive update than previous updates. I went back through all 'official' data that is publicly available and filled in every known data point for every possible date - more of the 'in-betweens.' The most recent previous updates used data points for 74 different dates. The new charts use data points for 106 different dates. That gives 43% better resolution to the curves. More details on this are included below the charts for those interested.
There are also more new charts that show the number of new Ebola cases or deaths per month. Click any graphic below to see it larger.


Charts and future projections were done by me, not by WHO. I am not an Ebola expert, epidemiologist, virologist, or MD, but I manually compiled the data used to create these graphs from news updates on the following WHO and New England Journal of Medicine websites:
SOURCE: WHO website 1
SOURCE: WHO website 2
SOURCE: WHO website 3
SOURCE: The New England Journal of Medicine
In Charts 3-5, I updated the latest known numbers but left the projection lines and shaded areas the same as on August 8, 2014 so that it will be obvious if the actual numbers start to deviate much from the projections. Please do not do anything you might regret based on projections. Efforts to contain, quarantine, treat, prevent, or cure Ebola will hopefully prove them wrong.
Additional info regarding this comprehensive update:
When I created the first charts, I only created charts for total numbers of cases and deaths and some of my own possible future projections based on this data. Since it was very time consuming to compile the data and since I only needed enough data points to graph the curves of the total increases, I didn't include every single update from WHO in the data for the first charts.
Later, I added additional graphs, often at the request of other ATS members. It became obvious that it would be better to have all known data in the data tables that create the graphs. That would allow me to display the data in higher detail and in a greater variety of ways.
Honestly, I was hoping by now it would be a moot point, that the outbreak would somehow be controlled by now and the projections would not be fulfilled. So far the outbreak continues. Over the last four days, I spent some spare time going back through ALL of the data regarding the earliest known cases from The New England Journal of Medicine as well as all outbreak news updates released by WHO from the time they first began covering this outbreak through their latest update. I went through all of these updates in great detail, redoing my data tables and filling in every single data point as accurately as possible, and even by country as well as totals.
This is actually not too easy. Prior to WHO's July 1, 2014 update, the WHO data was not presented in standardized tables and the data in the updates often doesn't quite add up along with previous or later updates. New updates often corrected old data with newer information plus added new data. For example, if a past update stated there were 100 cases but a later update might rule out 20 cases as not being Ebola but might add 10 new cases. This complicates the ability to compile correct data over time and affects the accuracy of the graph curves.
I tried to stick as closely as possible to the numbers reported by WHO. But where it was obvious that changes in known data occurred and were large enough to affect the curves, I tried to correct the past data in my data tables. For example if previous data indicated there were 100 cases in a country but new data ruled out 70 cases as not being Ebola, I corrected the past data so that the charts would more accurately reflect real data.
In general, I only made such corrections where they were obvious and were large enough to significantly affect the graph curves. I didn't correct every single instance of this. It would take a huge amount of time and small differences would not noticeably affect the graph curves. It's also quite obvious that WHO's data is not accurate enough to be so certain of exact numbers at any point.
These charts are based on the most accurate data currently publicly available. But as with any data, you should assume there is (at least) an implied limitation of +/- some small error percentage. It's also worth noting that even WHO believes the number of cases and deaths are drastically under-reported by the countries experiencing the outbreak(s). One of the charitable organizations that has provided medical assistance during the outbreak(s), Samaritan's Purse, estimated that only 25% of actual cases and deaths in this outbreak may be reported.
Thank you again for your work, ikonoklast. I don't know if it can be considered as a compliment, but you post some scary graphics here.
WHO haven't updated their numbers since August 22, that's 5 days now. I think they're pondering whether to include Congo in their tables.
WHO haven't updated their numbers since August 22, that's 5 days now. I think they're pondering whether to include Congo in their tables.
originally posted by: Lexman55
a reply to: ikonoklast
...how does one calculate the undereporting the WHO refers to? The anecdotal evidence is horrendous...
In the WHO article one person says 20% is a conservative estimate..... yup, VERY conservative. I am fearing two or three or four fold.
It's probably impossible to calculate the under-reporting. I use the WHO numbers because they are official and the best available. Journalists in the hardest-hit areas report dead bodies being immediately destroyed without testing and whole villages where everyone is dead. In the capital of Liberia, Monrovia, the military has quarantined an area of the city with 50,000-75,000 people inside.
I've seen estimates from medical volunteers there that at most 20 or 25% of cases and deaths are reported. Just looking at the news, it's pretty obvious it's probably much worse in some areas. I also wonder whether other countries now have unreported cases and deaths that are covered up. It's hard to believe that all of the suspected cases we've heard about were really negative.
I have just pulled all the suspected cases & deaths off the CDC daily reports and have listed them all out since the inception. Don't have charts. If it would help you or Starbucks for me to list it here, I'd be happy to contribute.
Thanks for the offer, I appreciate it, but I think I have the same numbers. The CDC appears to be using the numbers from the WHO updates. But I can also provide the data I have to you if it would help you.
We must be thinking along the same lines. I spent the last week going back over all WHO updates and the New England Journal of Medicine research on the earliest cases in great detail. I redid all of the data tables I have that generate the graphs. This time I pulled out all of the data by individual countries as well as totals, and for every date mentioned inside the updates rather than just totals as of the latest date in most of the updates.
It looks like Starbucks is gone, not sure if the ATS account was closed or if he/she was banned or something. Too bad, the newest data tables will allow the creation of graphs per country like Starbucks requested. I will probably produce a few charts like this per country in a few minutes. In the meantime, I redid all of the previous charts and added a couple more using the more detailed data. You can see the latest versions here:
www.abovetopsecret.com...
originally posted by: negue
Thank you again for your work, ikonoklast. I don't know if it can be considered as a compliment, but you post some scary graphics here.
WHO haven't updated their numbers since August 22, that's 5 days now. I think they're pondering whether to include Congo in their tables.
You would think reporters would be asking why?
a reply to: jadedANDcynical
Thank you, that's very interesting new info on the R0 numbers for each country. I'm glad to hear R0 is not as high as it might be. Unfortunately, the graphs are not looking nearly as optimistic as I would expect for those R0 numbers.
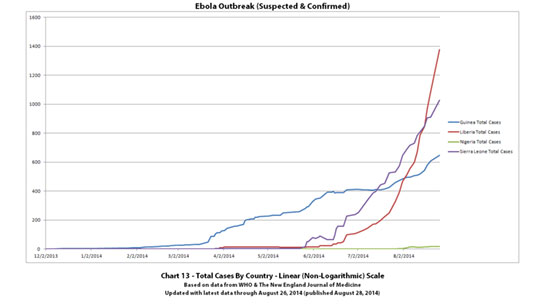
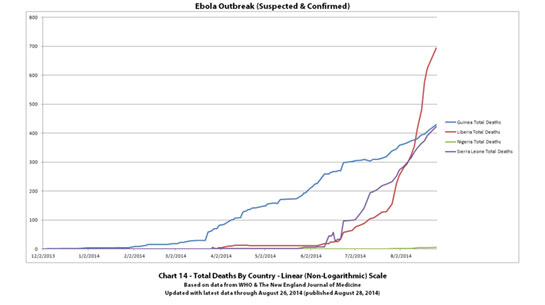
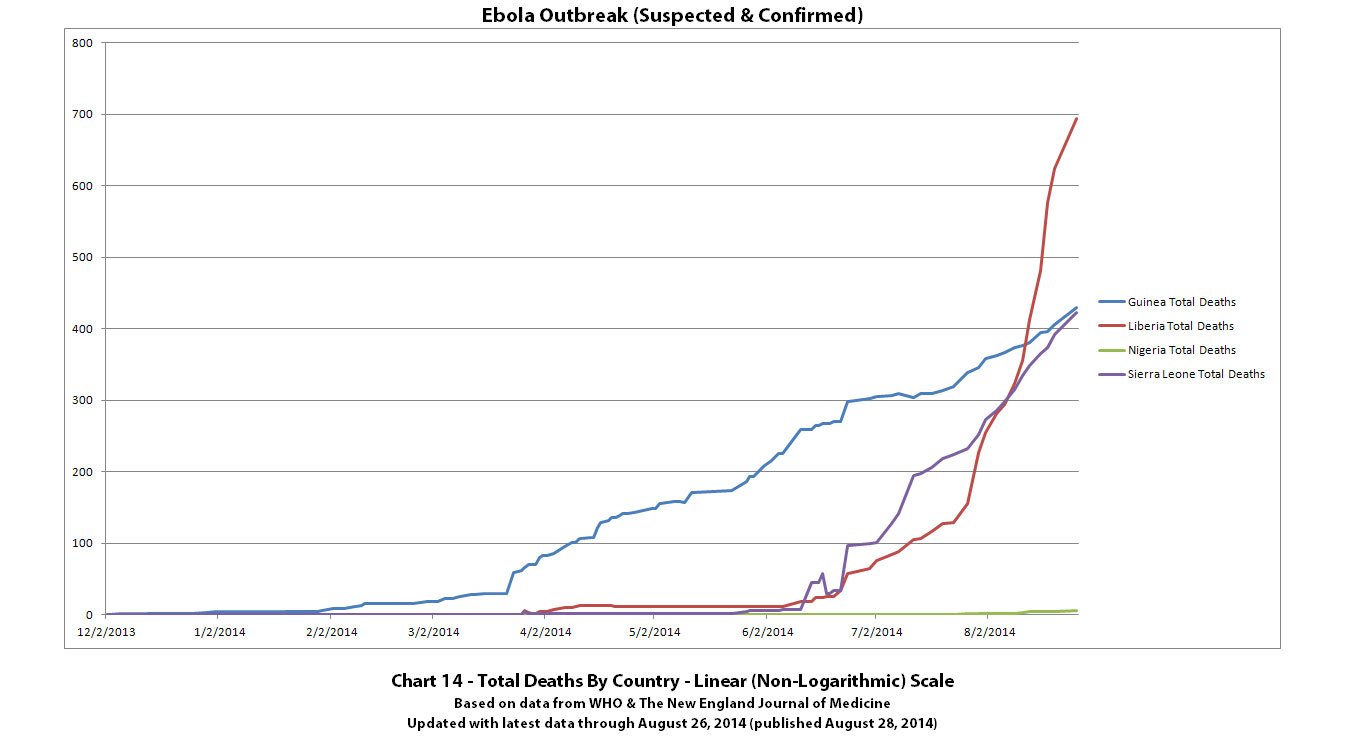
As mentioned in other recent posts, when I redid the data tables I pulled out all of the data by individual countries as well as totals now. Here are two new charts I've just finished which include WHO data through August 20, 2014. The first is total cases by country, the second is total deaths by country. Click either graphic for a larger image.
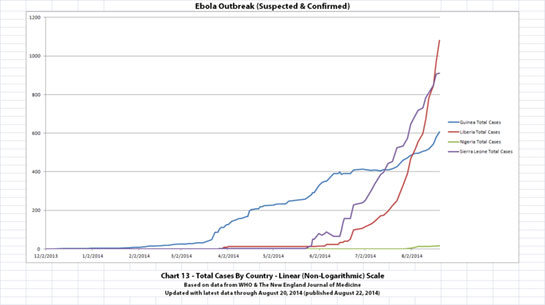
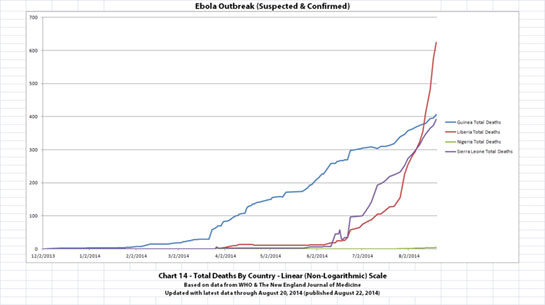
It's seriously bad in Liberia, and pretty bad in Guinea and Sierra Leone as well. Nigeria is not too bad, but I read recently they have the first secondary cases of Ebola there now. Previously, all cases in Nigeria traced to Sawyer. New cases apparently trace to people who had contact with Sawyer.
Same disclaimer and references as the other charts: Charts and future projections were done by me, not by WHO. I am not an Ebola expert, epidemiologist, virologist, or MD, but I manually compiled the data used to create these graphs from news updates on the following WHO and New England Journal of Medicine websites:
SOURCE: WHO website 1
SOURCE: WHO website 2
SOURCE: WHO website 3
SOURCE: The New England Journal of Medicine
Thank you, that's very interesting new info on the R0 numbers for each country. I'm glad to hear R0 is not as high as it might be. Unfortunately, the graphs are not looking nearly as optimistic as I would expect for those R0 numbers.
As mentioned in other recent posts, when I redid the data tables I pulled out all of the data by individual countries as well as totals now. Here are two new charts I've just finished which include WHO data through August 20, 2014. The first is total cases by country, the second is total deaths by country. Click either graphic for a larger image.
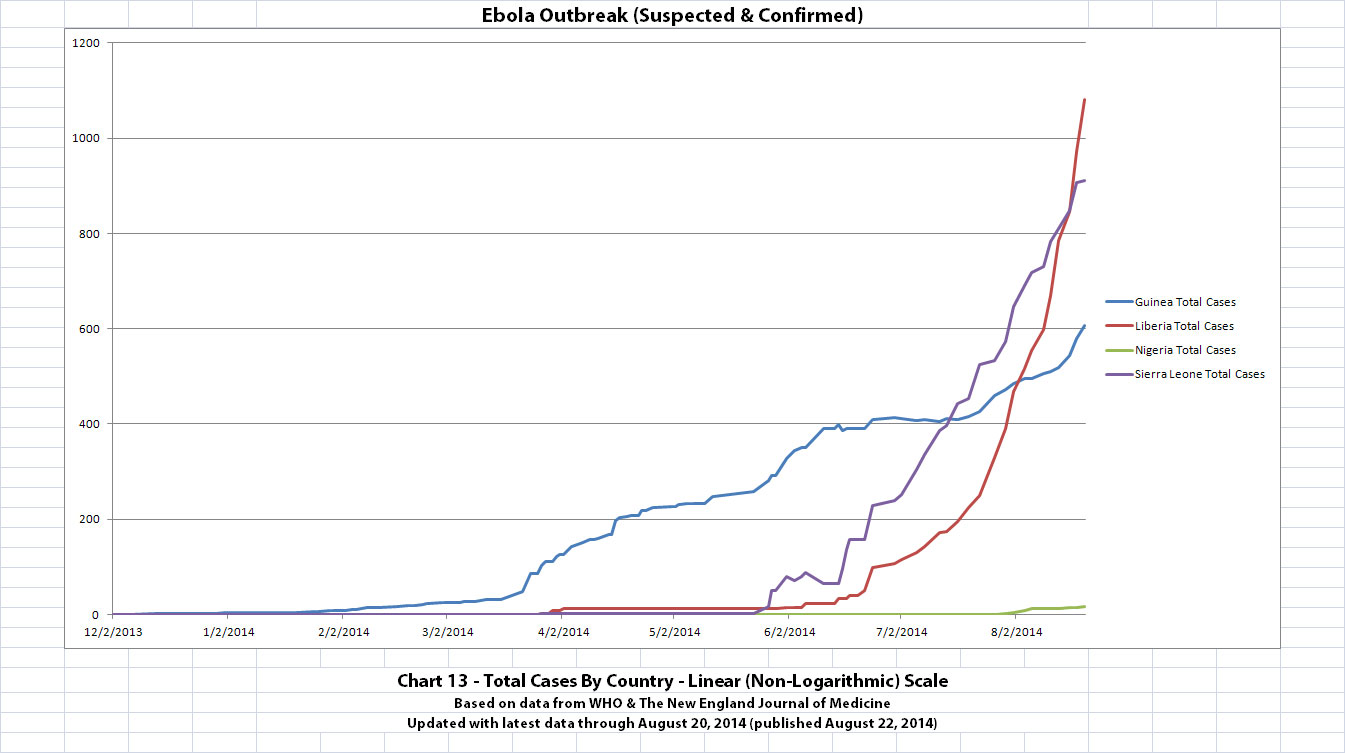
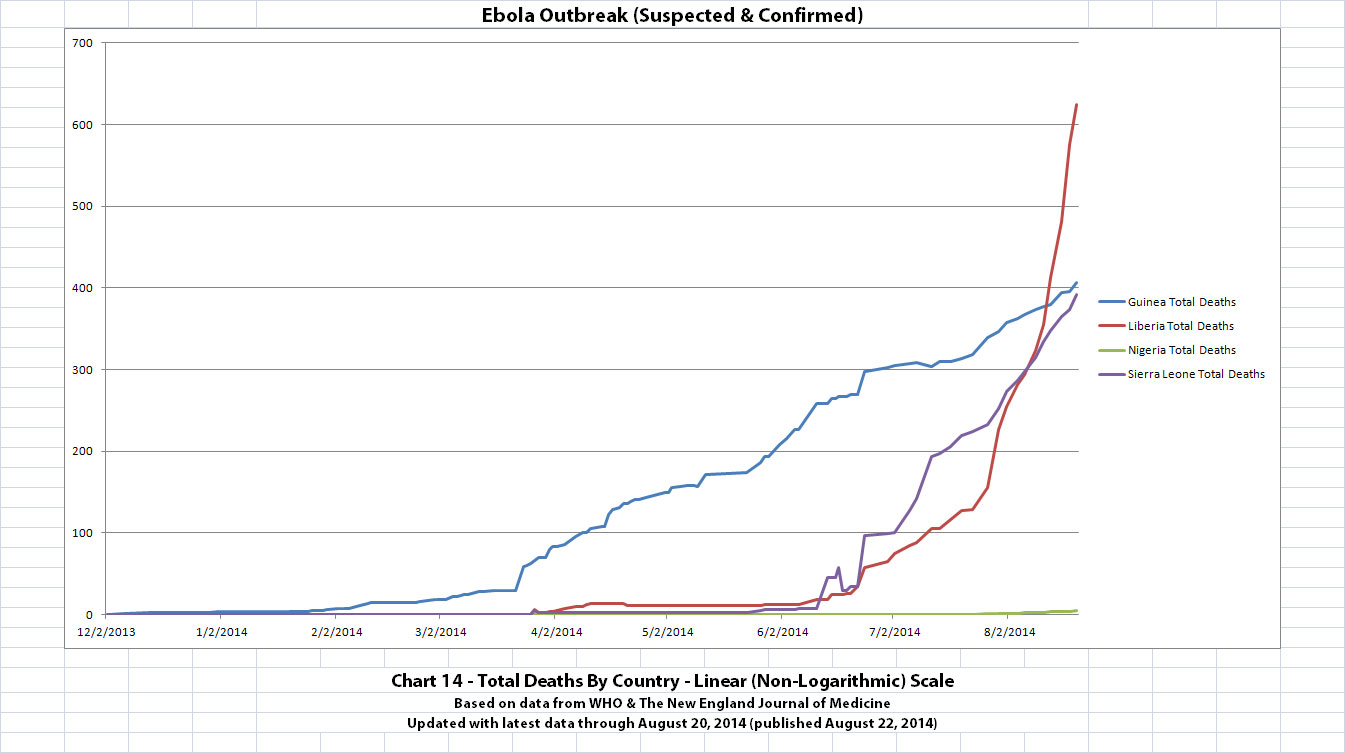
It's seriously bad in Liberia, and pretty bad in Guinea and Sierra Leone as well. Nigeria is not too bad, but I read recently they have the first secondary cases of Ebola there now. Previously, all cases in Nigeria traced to Sawyer. New cases apparently trace to people who had contact with Sawyer.
Same disclaimer and references as the other charts: Charts and future projections were done by me, not by WHO. I am not an Ebola expert, epidemiologist, virologist, or MD, but I manually compiled the data used to create these graphs from news updates on the following WHO and New England Journal of Medicine websites:
SOURCE: WHO website 1
SOURCE: WHO website 2
SOURCE: WHO website 3
SOURCE: The New England Journal of Medicine
originally posted by: negue
Thank you again for your work, ikonoklast. I don't know if it can be considered as a compliment, but you post some scary graphics here.
You're welcome, negue. I'll take it as a compliment, thanks. They scare me too.
WHO haven't updated their numbers since August 22, that's 5 days now. I think they're pondering whether to include Congo in their tables.
Yes, I was expecting an update yesterday, as that would be typical for how they have been doing the updates. I think you might be right. I was wondering whether to include the Congo also.
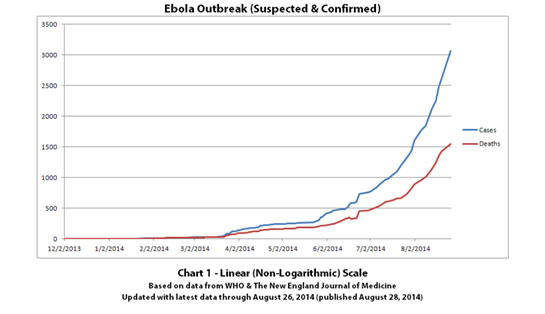
Finally an update today from WHO.....case count is 3069 with 1552 deaths, not including separate outbreak in Congo. The numbers look close to Ikon's
projections.
a reply to: fwkitziger
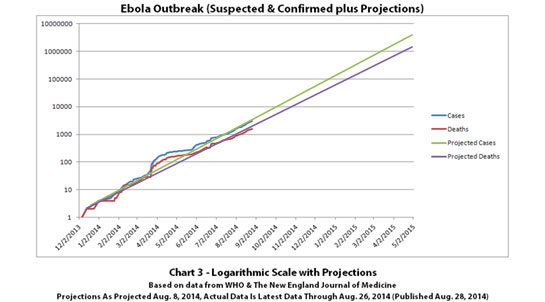
I just updated the Ebola outbreak charts with the newest update from WHO that just came out today, August 28, 2014 (covering through August 26, 2014). Sadly the new numbers do continue to match my projections all too closely. They are just barely off the line projections in Chart 3 and are within the projection ranges in Charts 4 and 5. I was really hoping the projections would be wrong.
It's all over the news today that WHO just announced the number of Ebola cases could top 20,000 before it can be controlled. Looking at charts 3 and 4, cases will top 20,000 by late October or early November if the current rates continue.
Click any graphic below to see it larger.


Charts and future projections were done by me, not by WHO. I am not an Ebola expert, epidemiologist, virologist, or MD, but I manually compiled the data used to create these graphs from news updates on the following WHO and New England Journal of Medicine websites:
SOURCE: WHO website 1
SOURCE: WHO website 2
SOURCE: WHO website 3
SOURCE: The New England Journal of Medicine
The numbers in the charts do not yet include the Ebola outbreak in the Congo. Currently that is believed to be a different strain and it is believed to be unrelated to this outbreak. If that situation changes or if the Congo outbreak is not contained, I may add it to these charts or create separate charts.
DISCLAIMER: Please do not do anything you might regret based on projections. Hopefully efforts to contain, quarantine, treat, prevent, or cure Ebola will eventually be successful, and hopefully sooner rather than later.
Oh snap, Just made a 45 minute post that disappeared.
Data:
7/2 - 7/30 = 12.78
8/1 - 8/10 = 18.2
8/9-8/18 = 37.74
8/19-8/26= 80.14
Month August proj = 1,064 deaths (664 thru 8/26 & 400 more at current rates)
Thx to Icon for new charts
8/28 WHO announcement rife with predictions that aren't based on current numbers. Scary
No more ZMapp. Proj. 10,000 doses untested new antidote Gee-Ess-Cay on 1/1/15. Current numbers proj 10,000 dead on 11/1/14
Get your ZMapp here! Members of Congress free. Private citizens 1 for 3M, 2 for 5M. (Tiny attempt at humor, sorry)
a reply to: ikonoklast
ETA: Just saw your new charts above - thanks. S&
Great stuff. Here's an "update" I hope you might chart, 'cuz I suspect your figures are ...conservative.
Science Magazine reports that the epidemic is doubling exponentially with a doubling period of 34.8 days.
1. Based on 3,069 reported cases (at August 26, 2014), the case total will reach 196,416 within about 6 months, and up to 12,570,624 cases after a year.
2. The WHO estimates unreported cases bring the total to 12,000 cases, which means cases would rise to 384,000 cases with in 6 months and 24,576,000 cases after a year.
3. Most likely the real case rate is much higher. There are no accessible hospitals or clinics for most West Africans - no one to test and diagnose, no one to report cases. Realistically, the actual case total is probably closer to 20,000 already. If that's true, then by 6 months the case total will be 640,000 and by one year - 40,960,000 cases.
If the transmission rate does not speed up.
As of 26 August 2014, the cumulative number of cases attributed to EVD in the four countries stands at 3069, including 1552 deaths.
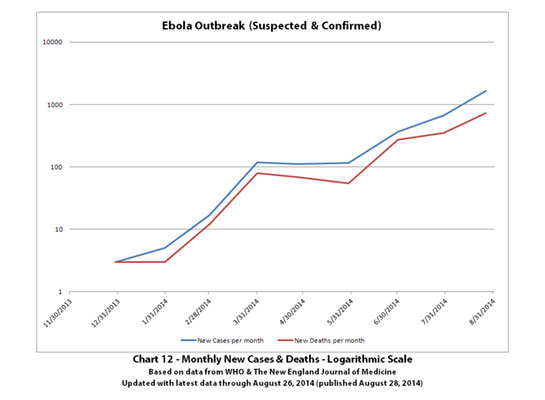
It is the largest known EVD outbreak and is expanding exponentially with a doubling period of 34.8 days (Fig. 1B).
edit on 29/8/14 by soficrow because: (no reason given)
Lexman55 and soficrow, you're welcome, glad the charts are useful.
soficrow, yes, I agree the figures are very conservative. I used the WHO numbers specifically because it would be hard for anyone to argue that the Ebola outbreak is not at least as bad as the numbers WHO is putting out. I knew there would be people who would argue that the outbreak is not as bad as some of us think.
You're right, even WHO has said these numbers are probably at most 25% of the actual numbers. You can get a picture of what that looks like by mentally multiplying each number on the y-axis of each chart by 4.
Thanks for the link to the Science Magazine reports, there is a lot of very good information there and I will take a more detailed look at it when I get a little more spare time. I think they may be underestimating how quickly the number of cases are doubling, though, with their estimate of every 34.8 days.
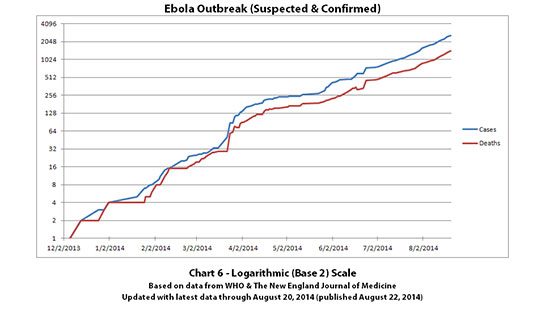
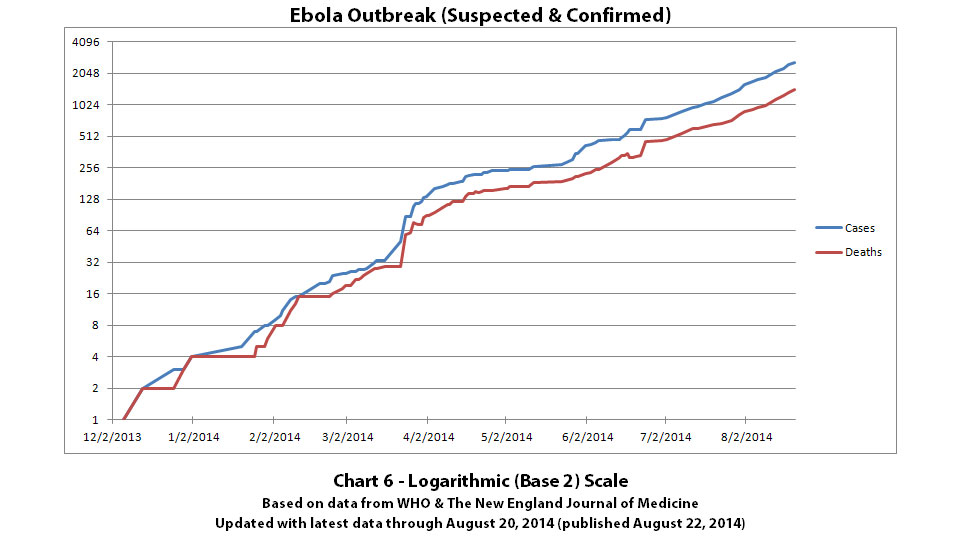
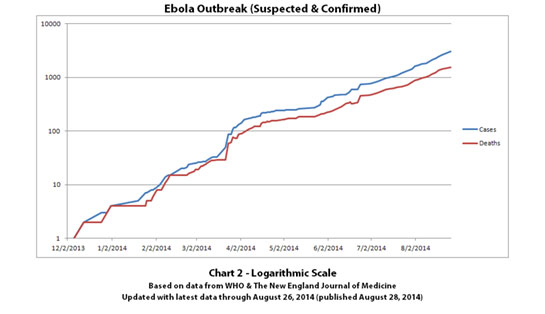
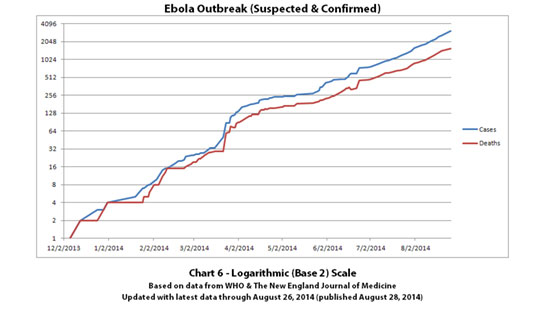
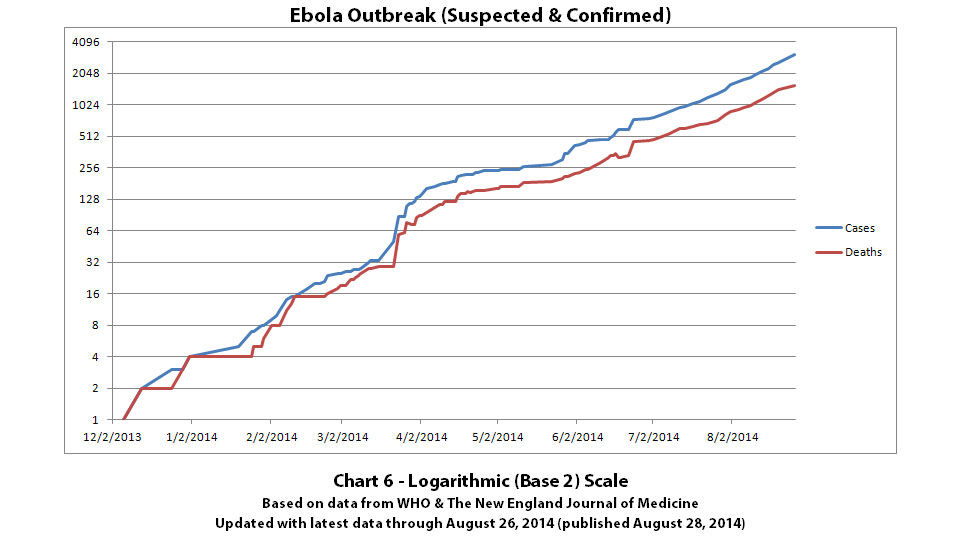
If you look at Chart 6, the y axis is in powers of 2. Each jump between horizontal lines is a doubling. Based on the New England Journal of Medicine's date of December 2, 2013 for the presumed first case and the WHO data from March 22, 2014 through August 26, 2014, cases have doubled 11.5 times in 269 days, which means they are doubling every 23.4 days. Even if you only count laboratory confirmed cases, cases have still doubled 10.75 times in 269 days, which means laboratory confirmed cases are doubling every 25.0 days.
soficrow, yes, I agree the figures are very conservative. I used the WHO numbers specifically because it would be hard for anyone to argue that the Ebola outbreak is not at least as bad as the numbers WHO is putting out. I knew there would be people who would argue that the outbreak is not as bad as some of us think.
You're right, even WHO has said these numbers are probably at most 25% of the actual numbers. You can get a picture of what that looks like by mentally multiplying each number on the y-axis of each chart by 4.
Thanks for the link to the Science Magazine reports, there is a lot of very good information there and I will take a more detailed look at it when I get a little more spare time. I think they may be underestimating how quickly the number of cases are doubling, though, with their estimate of every 34.8 days.
If you look at Chart 6, the y axis is in powers of 2. Each jump between horizontal lines is a doubling. Based on the New England Journal of Medicine's date of December 2, 2013 for the presumed first case and the WHO data from March 22, 2014 through August 26, 2014, cases have doubled 11.5 times in 269 days, which means they are doubling every 23.4 days. Even if you only count laboratory confirmed cases, cases have still doubled 10.75 times in 269 days, which means laboratory confirmed cases are doubling every 25.0 days.
joho99 posted this link in one of the other Ebola threads:
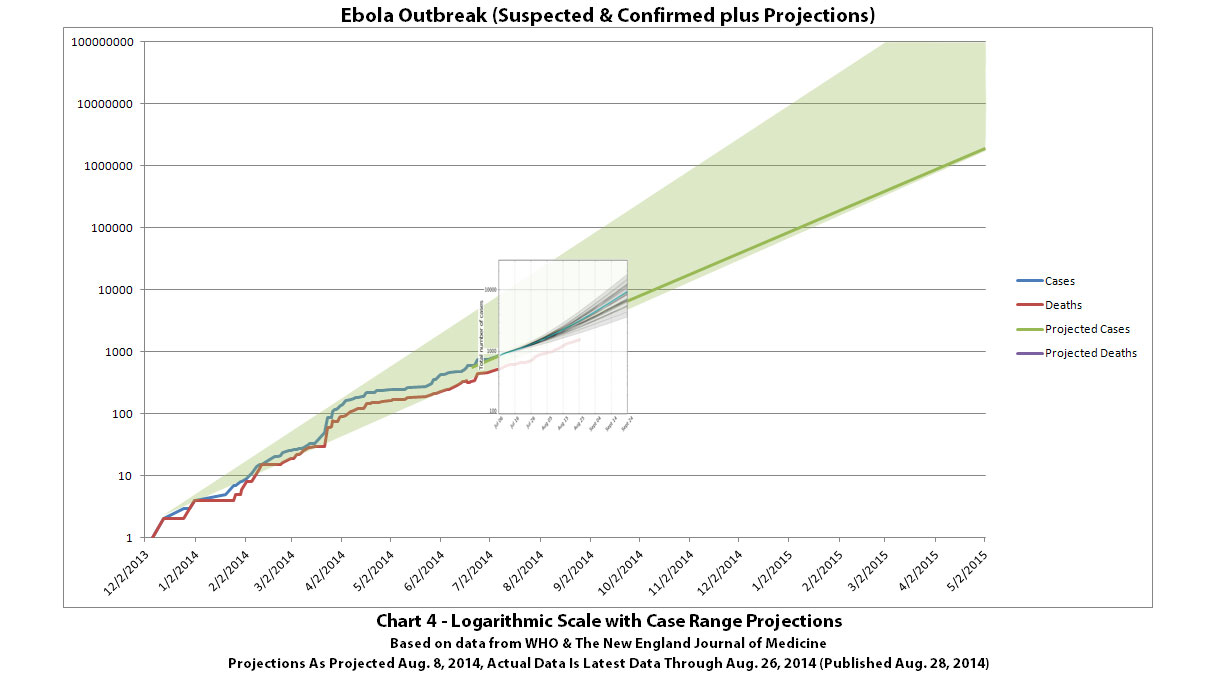
I was curious how Professor Alessandro Vespignani's projections lined up with the projections I've made in Chart 4, so I overlaid them onto Chart 4 to see. Vespignani's projections only cover from July 6, 2014 through September 24, 2014, so they are the tiny box overlaid on my larger Chart 4 here (click to view full size):
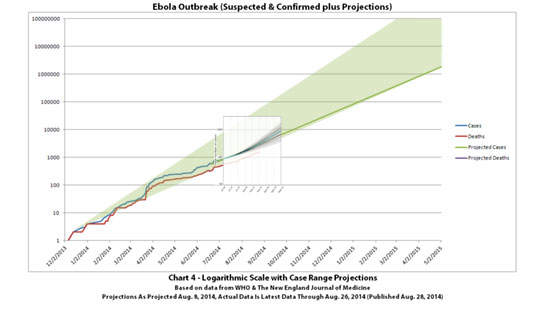
And here a small section of my Chart 4 is overlaid on Prof. Vespignani's projections so you can see similarities and differences more clearly (click to view full size):

Although Prof. Vespignani's projections in his graph cover a much smaller time segment, our independent projections overlap quite a bit for the same time period.
Edit to add: Professor Vespignani's credentials: Sternberg Distinguished Professor of Physics, Computer Science and Health Sciences at Northeastern University in Boston, Massachusetts.
Disease modelers project a rapidly rising toll from Ebola
Based on the known numbers.
I was curious how Professor Alessandro Vespignani's projections lined up with the projections I've made in Chart 4, so I overlaid them onto Chart 4 to see. Vespignani's projections only cover from July 6, 2014 through September 24, 2014, so they are the tiny box overlaid on my larger Chart 4 here (click to view full size):
And here a small section of my Chart 4 is overlaid on Prof. Vespignani's projections so you can see similarities and differences more clearly (click to view full size):

Although Prof. Vespignani's projections in his graph cover a much smaller time segment, our independent projections overlap quite a bit for the same time period.
Edit to add: Professor Vespignani's credentials: Sternberg Distinguished Professor of Physics, Computer Science and Health Sciences at Northeastern University in Boston, Massachusetts.
edit on 1-9-2014
by ikonoklast because: Added Professor Vespignani's credentials
When I first did my projections, there were a few who said no one (other than me) does projections like this, the math was very bad, and you can't do
projections like this. I contended that people do and you can. Evidently
Professor Vespignani, Sternberg Distinguished Professor of Physics,
Computer Science and Health Sciences at Northeastern University in Boston, Massachusetts agrees. He does and did do projections like this also, and
in fact doing such projections is one of his areas of expertise.
Although they only published a graph of Prof. Vespignani's projections out through late September, he has run the projections out further and seen the same thing I have, because the article with his projections says:
SOURCE
Thanks to joho99 for the link to the article on Prof. Vespigani's projections.
Sorry kruphix, I wish you were right and reality wasn't tracking the projections so far. I agree with Prof. Vespigani... we all hope to see this NOT happening.
Although they only published a graph of Prof. Vespignani's projections out through late September, he has run the projections out further and seen the same thing I have, because the article with his projections says:
Extrapolating existing trends, the number of the sick and dying mounts rapidly from the current toll—more than 3000 cases and 1500 deaths—to around 10,000 cases by September 24, and hundreds of thousands in the months after that. “The numbers are really scary,” he says—although he stresses that the model assumes control efforts aren't stepped up. "We all hope to see this NOT happening," Vespigani writes in an e-mail.
SOURCE
Thanks to joho99 for the link to the article on Prof. Vespigani's projections.
Sorry kruphix, I wish you were right and reality wasn't tracking the projections so far. I agree with Prof. Vespigani... we all hope to see this NOT happening.
First of all I'd like to say that I am impressed with your work! I'd also like to thank you for the time spent in making all of these graphs and
give you a big pat on the back for beating the "experts" to these projections! It's neat how I've been doing the math in my head based off of the
who charts before I found your work. Now I'm able to quickly check here after the new numbers to really see if our expectations are becoming a
horrifying realty. It's also scary to see that the infection is out pacing my earlier guesstimations which I had thought were brutal and that by now
some major government organization would have halted it's spread.
The trouble you are having with the gaps between who data, try dividing the total increase by the number of days since the last update then use those numbers to plot points every 2 to 4 days? It sounds like a ton of work and you've already done so much and I know my suggestion is inadiquite to relay the point I'm trying to make. I could explains in more detail and maybe even help if you'd be interested in some assistance.
I must go for now, thank you again!
I'm also observing a shrinking number of days between the doubling period in the infected. I believe this should give your line on chart #4 a slight
upward curve.
originally posted by: Roudy1111
The trouble you are having with the gaps between who data, try dividing the total increase by the number of days since the last update then use those numbers to plot points every 2 to 4 days? It sounds like a ton of work and you've already done so much and I know my suggestion is inadiquite to relay the point I'm trying to make. I could explains in more detail and maybe even help if you'd be interested in some assistance.
I must go for now, thank you again!
You're welcome, I'm glad the charts are helpful for people, and thanks for the offer of assistance. I will definitely let people know if I need assistance.
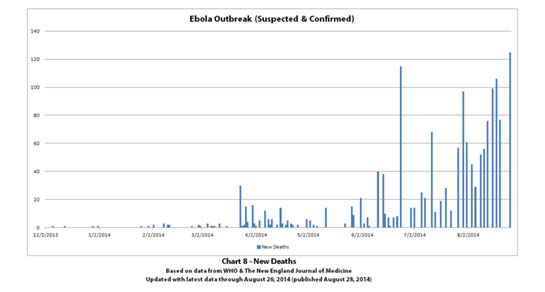
Lexman55 also previously mentioned using averages to calculate more points between updates, so I understand what you are suggesting. I've just done a test of this where I calculated the average new cases per day between updates and plotted points every 1 day. Here is the resulting chart (click to enlarge):

I haven't decided if I will do it for deaths also or whether I will maintain this going forward. It still yields a pretty spiky graph. I think the data in the updates is not consistent enough for such granular points. I suspect that spikes may be more spikes in reporting rather than spikes cases, but that's just a guess. Probably graphing new cases per month yields a more readable chart, but I'll have to think about it some more.
Just a heads-up: WHO says the death toll is 1,900+ www.abovetopsecret.com... out of 3,500 infected.
Nothing on their site yet.
So, um, prepare to spike the spike?
PS They're really stretching the updates. Last W Africa update was on Aug28.
Nothing on their site yet.
So, um, prepare to spike the spike?
PS They're really stretching the updates. Last W Africa update was on Aug28.
edit on 3-9-2014 by negue because: (no reason given)
a reply to: Roudy1111
It's definitely doubling faster. I'm actually working on some better modeling for the projections. Interestingly, the better modeling yields graphs that are sometimes barely distinguishable visually from the current projections, but there is more math behind them.
It's definitely doubling faster. I'm actually working on some better modeling for the projections. Interestingly, the better modeling yields graphs that are sometimes barely distinguishable visually from the current projections, but there is more math behind them.
new topics
-
I hate dreaming
Rant: 9 minutes ago -
Is the origin for the Eye of Horus the pineal gland?
General Conspiracies: 1 hours ago -
Man sets himself on fire outside Donald Trump trial
Mainstream News: 2 hours ago -
Biden says little kids flip him the bird all the time.
2024 Elections: 2 hours ago -
The Democrats Take Control the House - Look what happened while you were sleeping
US Political Madness: 2 hours ago -
Sheetz facing racial discrimination lawsuit for considering criminal history in hiring
Social Issues and Civil Unrest: 2 hours ago -
In an Historic First, In N Out Burger Permanently Closes a Location
Mainstream News: 4 hours ago -
MH370 Again....
Disaster Conspiracies: 5 hours ago -
Are you ready for the return of Jesus Christ? Have you been cleansed by His blood?
Religion, Faith, And Theology: 7 hours ago -
Chronological time line of open source information
History: 8 hours ago
top topics
-
In an Historic First, In N Out Burger Permanently Closes a Location
Mainstream News: 4 hours ago, 14 flags -
The Democrats Take Control the House - Look what happened while you were sleeping
US Political Madness: 2 hours ago, 9 flags -
Thousands Of Young Ukrainian Men Trying To Flee The Country To Avoid Conscription And The War
Other Current Events: 15 hours ago, 8 flags -
A man of the people
Medical Issues & Conspiracies: 10 hours ago, 8 flags -
Man sets himself on fire outside Donald Trump trial
Mainstream News: 2 hours ago, 7 flags -
Biden says little kids flip him the bird all the time.
2024 Elections: 2 hours ago, 6 flags -
4 plans of US elites to defeat Russia
New World Order: 11 hours ago, 4 flags -
Are you ready for the return of Jesus Christ? Have you been cleansed by His blood?
Religion, Faith, And Theology: 7 hours ago, 3 flags -
Is the origin for the Eye of Horus the pineal gland?
General Conspiracies: 1 hours ago, 3 flags -
Sheetz facing racial discrimination lawsuit for considering criminal history in hiring
Social Issues and Civil Unrest: 2 hours ago, 3 flags
active topics
-
Is the origin for the Eye of Horus the pineal gland?
General Conspiracies • 4 • : JoelSnape -
Man sets himself on fire outside Donald Trump trial
Mainstream News • 18 • : nugget1 -
Biden says little kids flip him the bird all the time.
2024 Elections • 9 • : FlyersFan -
12 jurors selected in Trump criminal trial
US Political Madness • 87 • : ImagoDei -
Fossils in Greece Suggest Human Ancestors Evolved in Europe, Not Africa
Origins and Creationism • 72 • : Xtrozero -
I hate dreaming
Rant • 0 • : FlyersFan -
MH370 Again....
Disaster Conspiracies • 8 • : Lazy88 -
Do we live in a simulation similar to The Matrix 1999?
ATS Skunk Works • 27 • : purplemer -
Thousands Of Young Ukrainian Men Trying To Flee The Country To Avoid Conscription And The War
Other Current Events • 27 • : Xtrozero -
911 emergency lines are DOWN across multiple states
Breaking Alternative News • 8 • : nugget1