It looks like you're using an Ad Blocker.
Please white-list or disable AboveTopSecret.com in your ad-blocking tool.
Thank you.
Some features of ATS will be disabled while you continue to use an ad-blocker.

Ebola - my visual charts & projections based on WHO data
page: 6share:
a reply to: ikonoklast
can you redo charts but this time dont add new cases to the curve but every day or every week show how many new cases.
this will give us idea about the curves up and down.
can you make a curve for nigeria only, or by state.
so for example in day 5 4 new cases discovered but 1000 cases already discovered you just plot the five cases for that day not the cummulative case up to that day.
edit on 16-8-2014 by Starbucks because: (no reason given)
originally posted by: Starbucks
a reply to: ikonoklast
can you make a curve for nigeria only, or by state.
so for example in day 5 4 new cases discovered but 1000 cases already discovered you just plot the five cases for that day not the cummulative case up to that day.
The data tables I generate the graphs from aren't set up on a per country or state basis. To change that, I would have to go back and redo them from the beginning. I don't currently have the time, but you can get the data from WHO here, updated every few days, and they do break it out by country:
WHO Ebola Outbreak Updates
can you redo charts but this time dont add new cases to the curve but every day or every week show how many new cases.
this will give us idea about the curves up and down.
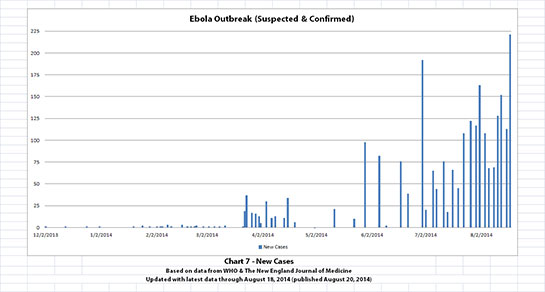
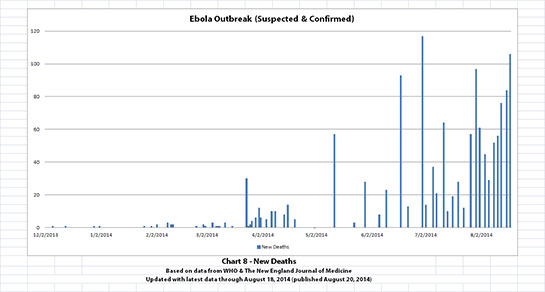
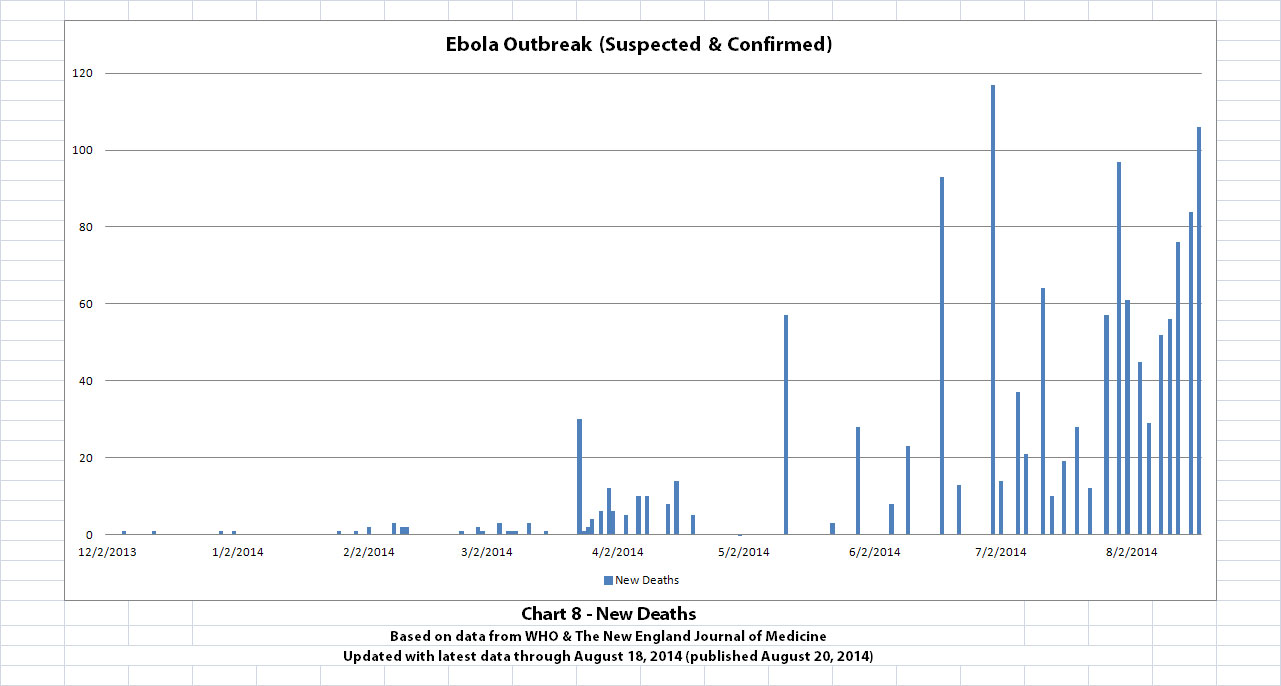
I've actually been working on this. I've developed two new charts based on the CDC's tutorial on creating epidemic curve bar graphs. Chart 7 is a graph of new cases. Chart 8 is a graph of new deaths. Click on either graphic to view it larger.
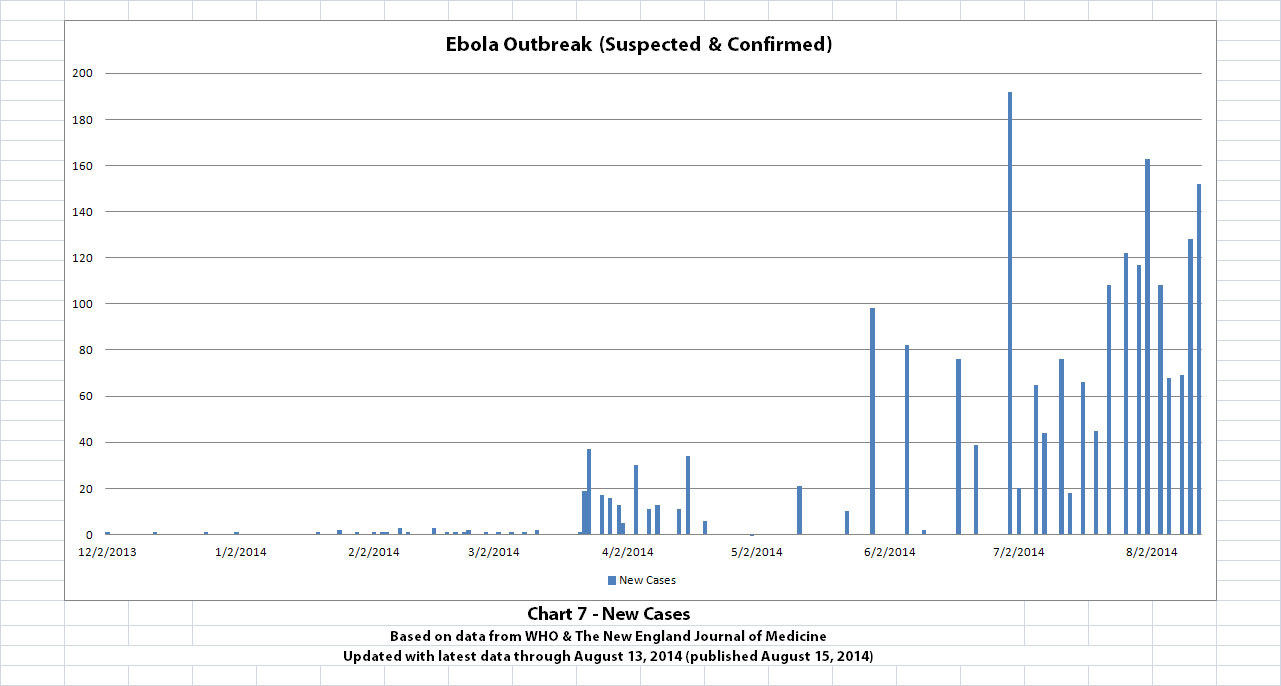
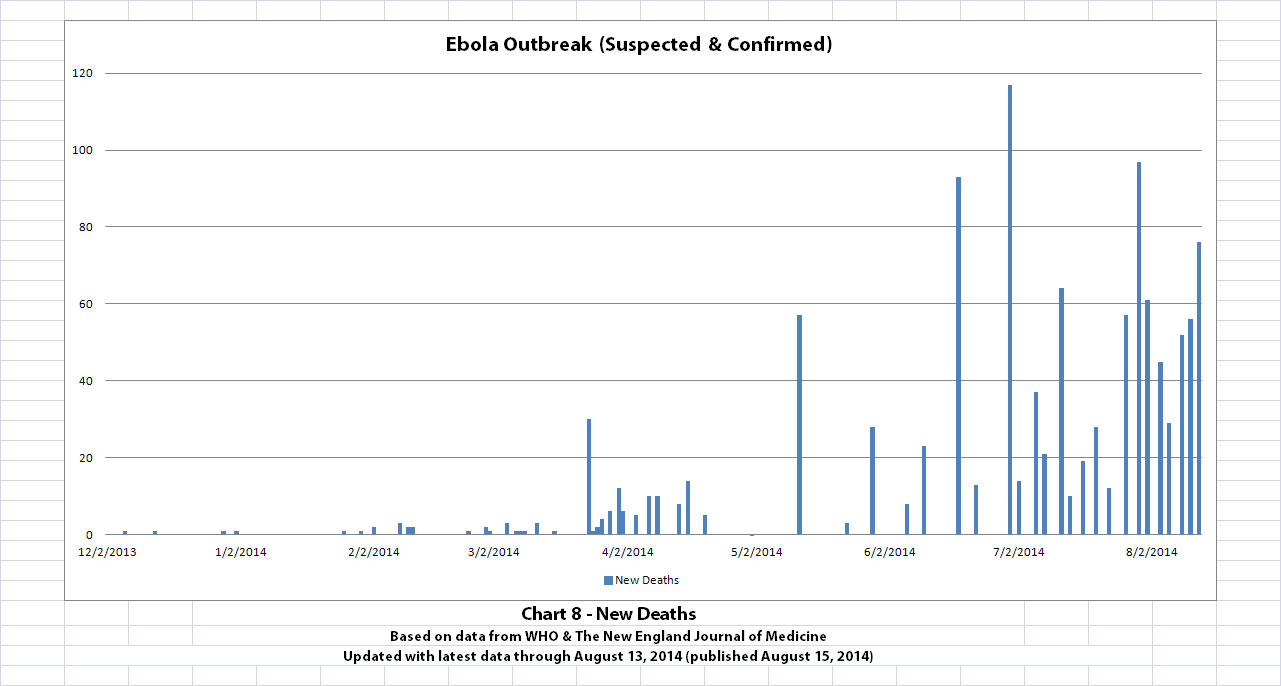
Like the other charts, the data since late March is from WHO and the earliest data is from The New England Journal of Medicine.
wow these are great new charts. very informative.
I wanted to know if there are multiple curves overlapping, but it seems it is not the case, I still have to study them
I am sorry but i have phobia of numbers and too much data. i cant possibly make the charts.
I can see curves separated by intervals and peek for every curve.
very interesting.
I wonder if you could do them by the day, not by the week.
edit on 16-8-2014 by Starbucks because: (no reason given)
a reply to: Starbucks
Glad they are helpful. They are actually not done by day or week. WHO releases data at irregular intervals, usually every 2-4 days, but sometimes more than a week between updates. I try to update the charts now when they release new data, but there is no data for in-between dates.
There are probably also still a few missing data points between some middle dates on the charts. For graphs of totals, I didn't necessarily need updates every two days, I just needed enough points to plot a reasonably accurate totals curve. It was very time consuming to manually gather the initial data. I've been going back now and filling in in-between data as I have time, and adding data from every new update.
At first I didn't do new cases and deaths graphs because irregular times between data can cause 'clumping.' For example, if WHO reported 10 new cases and a couple days later another 10, that's two bars on the graph, each 10 high but close together. But WHO might instead skip the first report and only issue the one report a couple days later showing 20 new cases. It's the same number of new cases in the same time. But it would produce one bar 20 high with a bigger gap in front.
So be careful what conclusions you draw from the new cases and deaths graphs. Some gaps and peaks are more a result of report (in)frequency rather than actual lulls and peaks of the outbreak.
If it makes sense, just recognize each bar is an update. The amount of space between bars gives you a rough idea of the time period the new data occurred over. So if a bar is really big but there is a big gap between it and the previous bar, remember that that's the new numbers over a longer time period. If the bars are getting bigger and are all really close together, that's an actual increase.
That's why I did totals at first. It was easier to create a reasonably accurate graph despite irregular reports. It's harder to accurately depict new cases and deaths at a glance with irregular updates. You have to understand a bit what the bars and spaces between bars mean as a whole. But I do see benefit now to being able to roughly tell whether new cases and deaths are increasing, decreasing, or staying about the same.
Also remember, WHO is dependent on the data reported to them by nations affected. Even WHO and the CDC have stated they believe those numbers are way under-reported.
originally posted by: Starbucks
wow these are great new charts. very informative.
I wanted to know if there are multiple curves overlapping, but it seems it is not the case, I still have to study them
I am sorry but i have phobia of numbers and too much data. i cant possibly make the charts.
I can see curves separated by intervals and peek for every curve.
very interesting.
I wonder if you could do them by the day, not by the week.
Glad they are helpful. They are actually not done by day or week. WHO releases data at irregular intervals, usually every 2-4 days, but sometimes more than a week between updates. I try to update the charts now when they release new data, but there is no data for in-between dates.
There are probably also still a few missing data points between some middle dates on the charts. For graphs of totals, I didn't necessarily need updates every two days, I just needed enough points to plot a reasonably accurate totals curve. It was very time consuming to manually gather the initial data. I've been going back now and filling in in-between data as I have time, and adding data from every new update.
At first I didn't do new cases and deaths graphs because irregular times between data can cause 'clumping.' For example, if WHO reported 10 new cases and a couple days later another 10, that's two bars on the graph, each 10 high but close together. But WHO might instead skip the first report and only issue the one report a couple days later showing 20 new cases. It's the same number of new cases in the same time. But it would produce one bar 20 high with a bigger gap in front.
So be careful what conclusions you draw from the new cases and deaths graphs. Some gaps and peaks are more a result of report (in)frequency rather than actual lulls and peaks of the outbreak.
If it makes sense, just recognize each bar is an update. The amount of space between bars gives you a rough idea of the time period the new data occurred over. So if a bar is really big but there is a big gap between it and the previous bar, remember that that's the new numbers over a longer time period. If the bars are getting bigger and are all really close together, that's an actual increase.
That's why I did totals at first. It was easier to create a reasonably accurate graph despite irregular reports. It's harder to accurately depict new cases and deaths at a glance with irregular updates. You have to understand a bit what the bars and spaces between bars mean as a whole. But I do see benefit now to being able to roughly tell whether new cases and deaths are increasing, decreasing, or staying about the same.
Also remember, WHO is dependent on the data reported to them by nations affected. Even WHO and the CDC have stated they believe those numbers are way under-reported.
yes i tell you they could do better than that . they supposed to have charts but no where to find.
they could make charts by day of symptoms onset by the day.
however your chart show spaces between curves which is good news. I al still bewildered by their statement that same strain can have incubation period from 2 days to 21 days. I think they are openly lying.
there must be several strains, but then how could several strains at the same time natural.
you will need index case for each strain (it is like several strains hit gorillas in the jungle and then people ate the dead bodies and got infected.
You dont have to get infected every time you eat a dead caracas, probably you need to eat 100 caracas untill you get infected, and then several strains!!!
so unbelievable.
somebody messed up big time.
these viruses hurt humans the least. they are very deadly to apes but then they are deadly to any! animal get infected.
there is nothing set in stone about anything. virus only need a chance to replicate. it does not see victim or have preferences.
www.foreignpolicy.com...
Laurie Garrett is senior fellow for global health at the Council on Foreign Relations and a Pulitzer Prize winning science writer. she says in the article
"Wake up, fools. What's going on in West Africa now isn't Brown's silly Inferno scenario -- it's Steven Soderbergh's movie Contagion, though without a modicum of its high-tech capacity.
Last week, my brilliant Council on Foreign Relations colleague John Campbell, former U.S. ambassador to Nigeria, warned that spread of the virus inside Lagos -- which has a population of 22 million -- would instantly transform this situation into a worldwide crisis
!!!"
expecting to see your updated charts anytime now Eere's the latest figures from the WHO and some charts as per
Wiki:
And their chart:
And this one started soon after (kind of makes one wonder where they got the idea) you made the bar chart of daily reported cases and deaths, same concept, different type of chart:
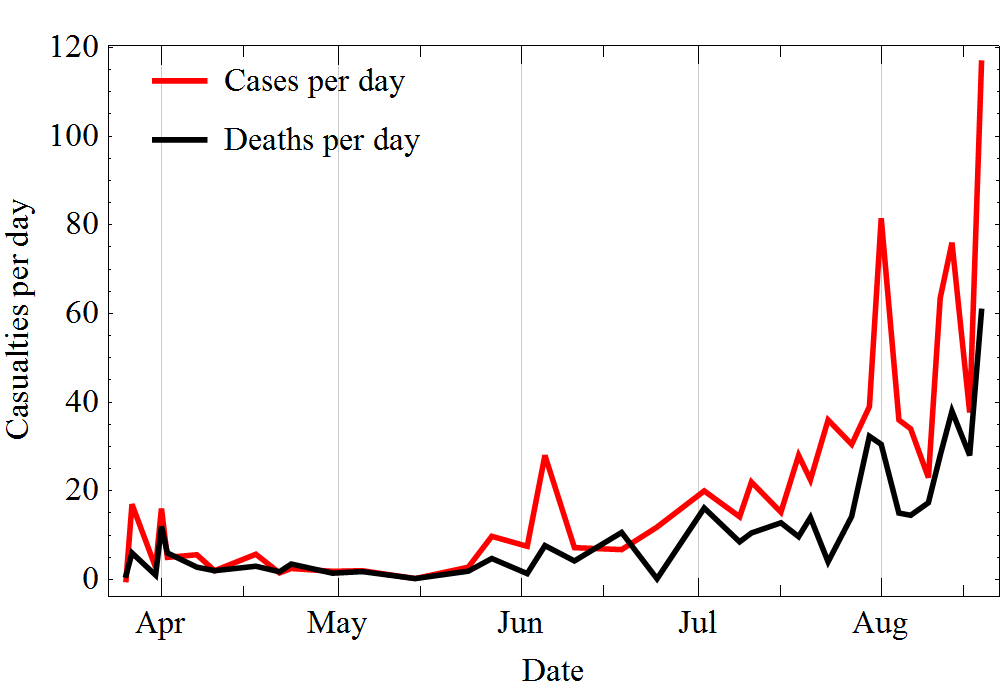
Seeing a noticeable upward trend on this chart is a very. Bad. Thing.
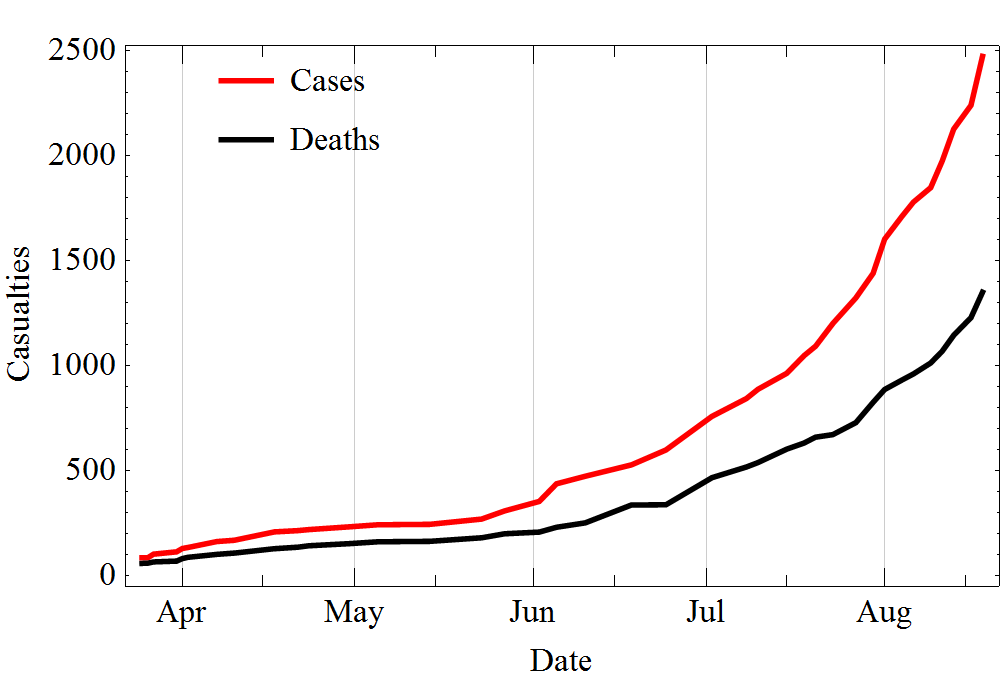
18 Aug 2014 cases: 2,473 deaths: 1,350
And their chart:
And this one started soon after (kind of makes one wonder where they got the idea) you made the bar chart of daily reported cases and deaths, same concept, different type of chart:
Seeing a noticeable upward trend on this chart is a very. Bad. Thing.
a reply to: jadedANDcynical
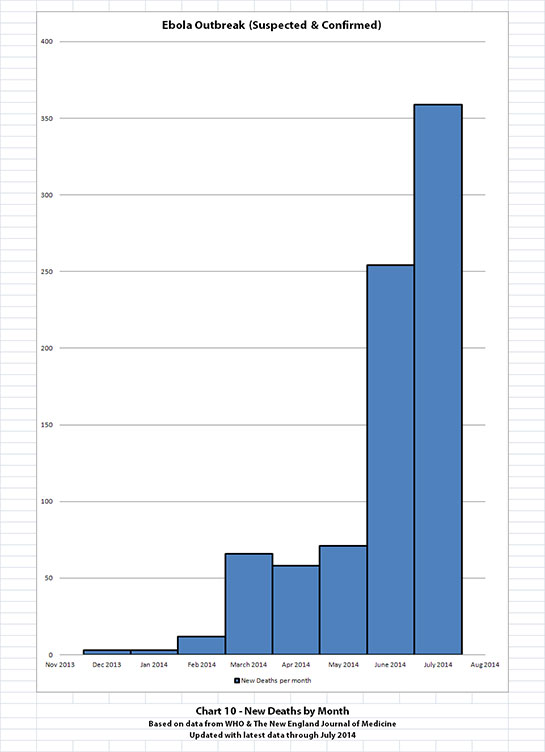
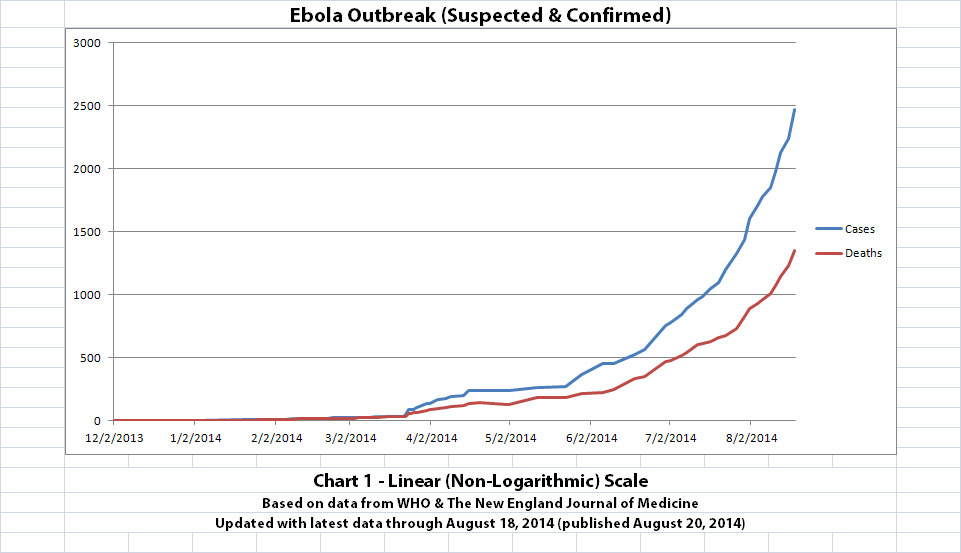
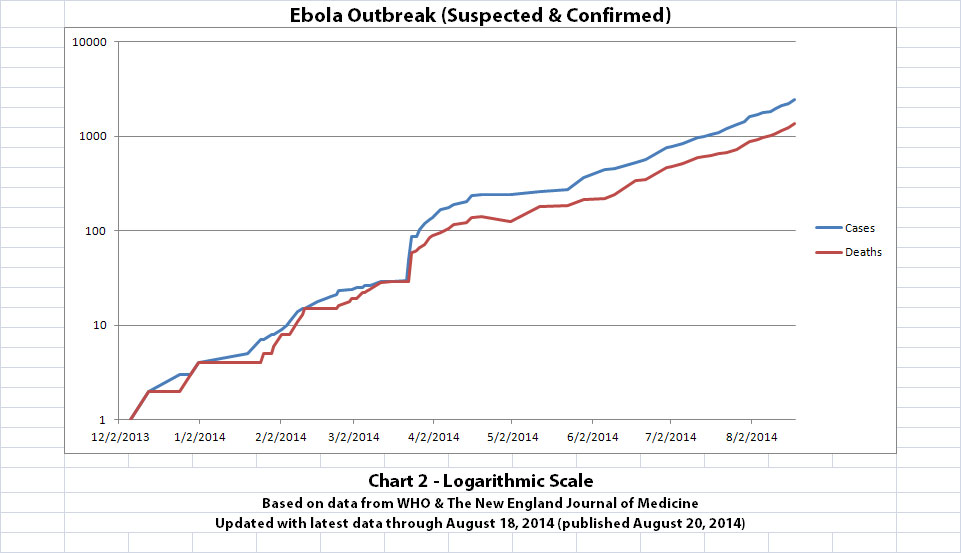
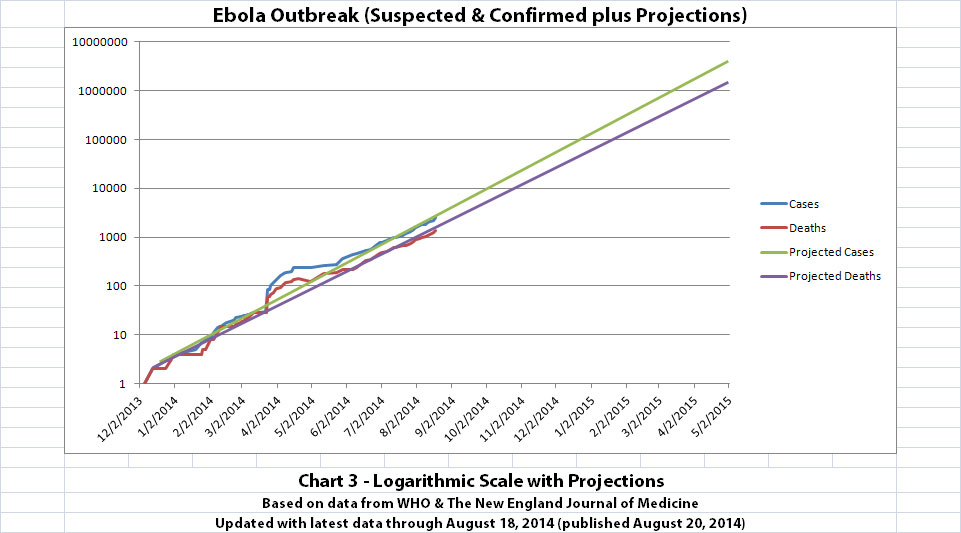
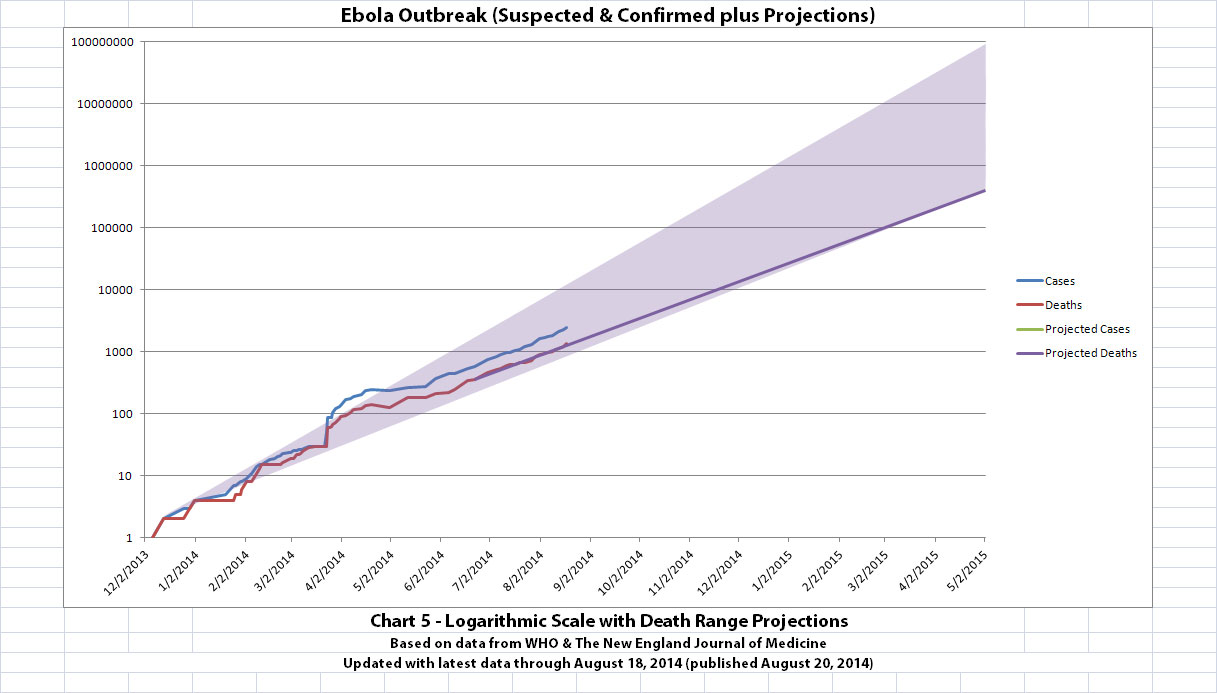
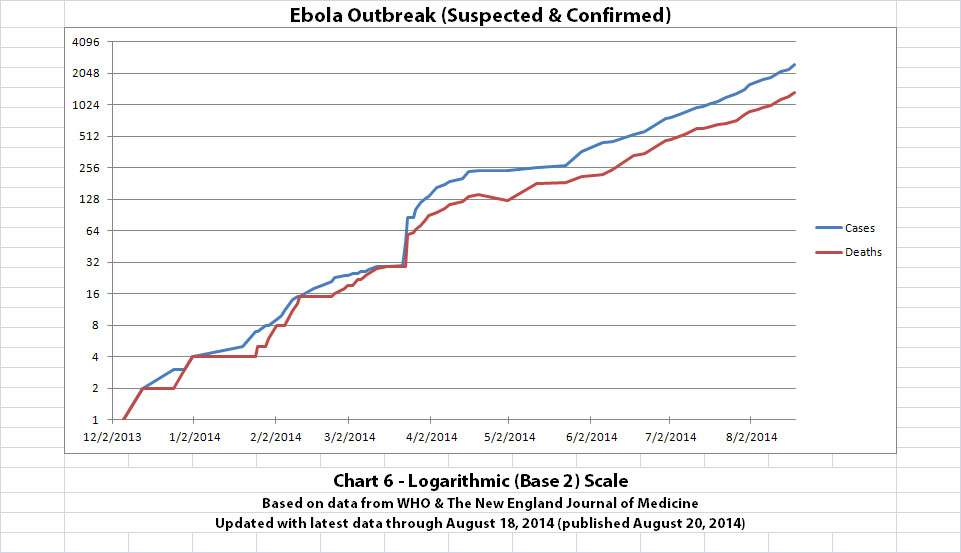
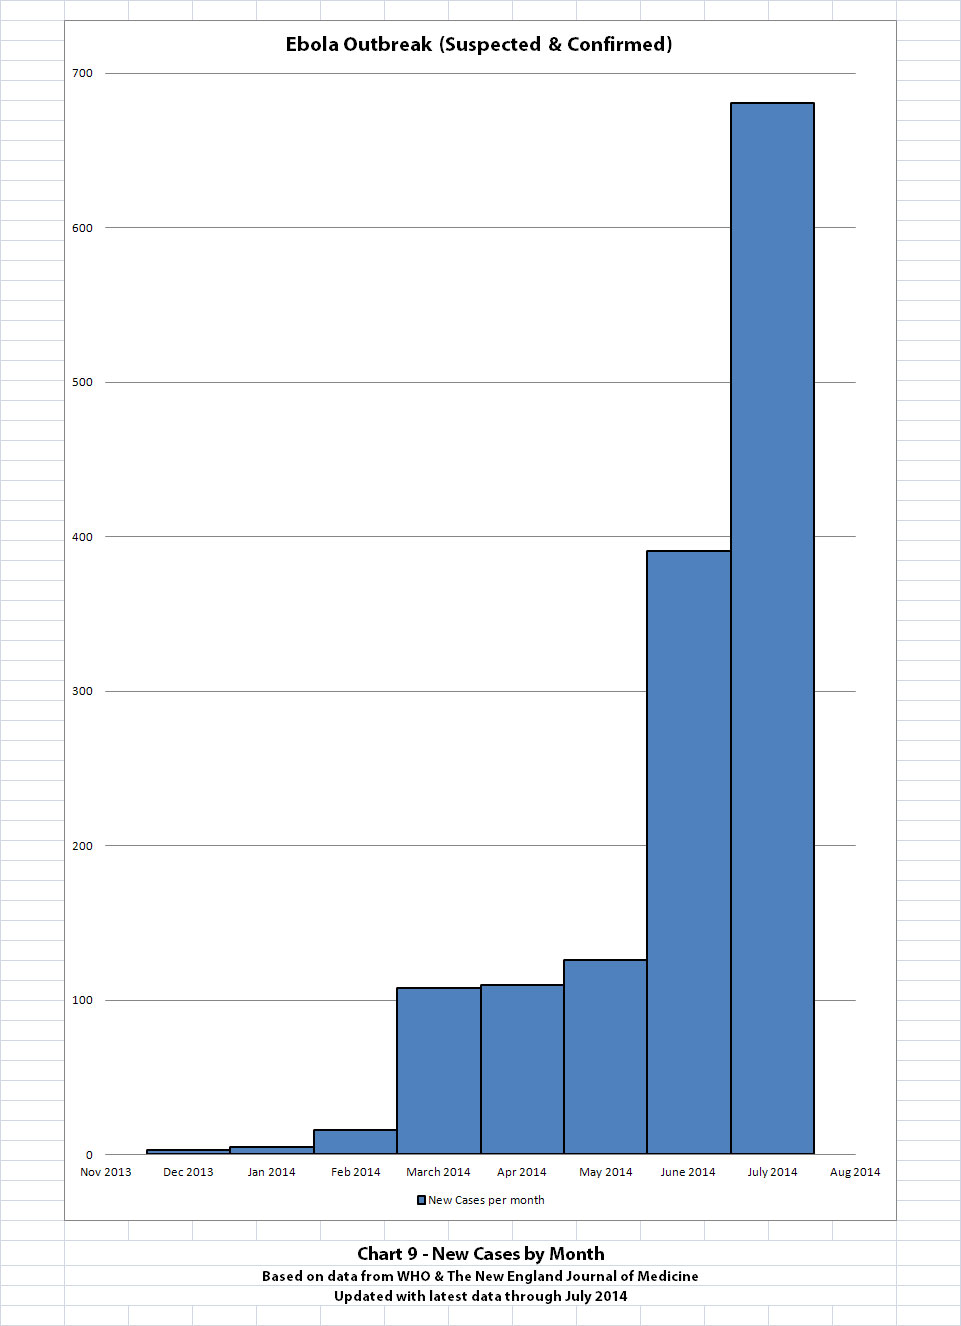
Here you go. I updated the Ebola outbreak charts with the new data WHO released today. That data covers through August 18, 2014. There are also some new charts that show the number of new Ebola cases or deaths per month. Click any graphic below to see it larger.
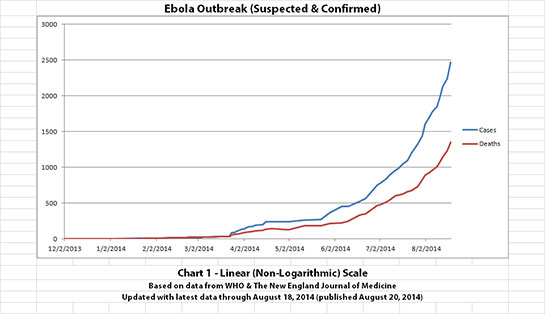
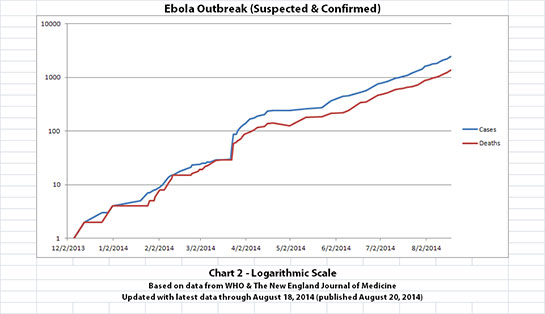

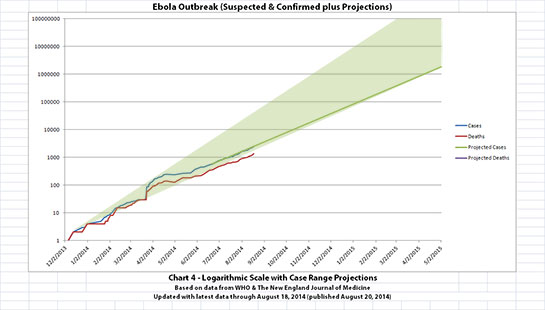
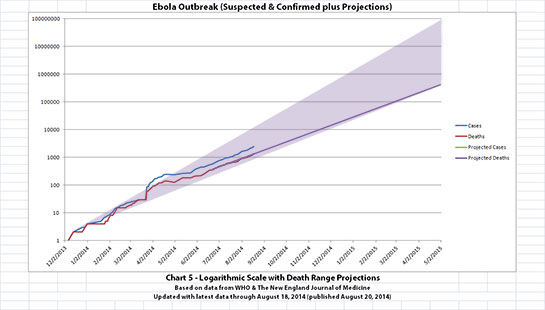
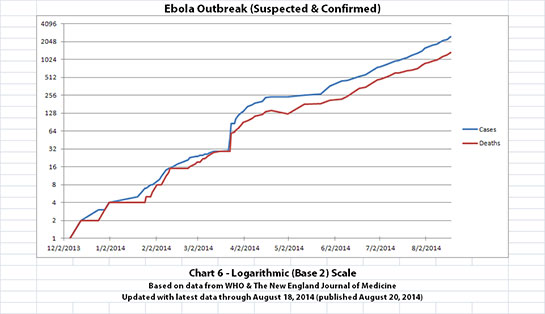

Charts and future projections were done by me, not by WHO. I am not an Ebola expert, epidemiologist, virologist, or MD, and I hope the projections are wrong. For Charts 3-5, I updated the currently known numbers but left the projections the same as on August 8, 2014.
The projections are controversial. Most appreciate them, but a few think they grossly under or overestimate or try to project what cannot be projected. Please do not do anything you might regret based on these projections. Efforts to contain, quarantine, treat, prevent, or cure Ebola will hopefully prove them wrong.
Data through August 18, 2014 came from news updates on the following WHO and The New England Journal of Medicine websites:
SOURCE: WHO website 1
SOURCE: WHO website 2
SOURCE: WHO website 3
SOURCE: The New England Journal of Medicine
Here you go. I updated the Ebola outbreak charts with the new data WHO released today. That data covers through August 18, 2014. There are also some new charts that show the number of new Ebola cases or deaths per month. Click any graphic below to see it larger.


Charts and future projections were done by me, not by WHO. I am not an Ebola expert, epidemiologist, virologist, or MD, and I hope the projections are wrong. For Charts 3-5, I updated the currently known numbers but left the projections the same as on August 8, 2014.
The projections are controversial. Most appreciate them, but a few think they grossly under or overestimate or try to project what cannot be projected. Please do not do anything you might regret based on these projections. Efforts to contain, quarantine, treat, prevent, or cure Ebola will hopefully prove them wrong.
Data through August 18, 2014 came from news updates on the following WHO and The New England Journal of Medicine websites:
SOURCE: WHO website 1
SOURCE: WHO website 2
SOURCE: WHO website 3
SOURCE: The New England Journal of Medicine
originally posted by: ikonoklast
Charts and future projections were done by me, not by WHO. I am not an Ebola expert, epidemiologist, virologist, or MD, and I hope the projections are wrong.
Currently the total number of confirmed deaths is doubling every 30 days. Well, keep doubling that until June or July 2016 and see what number you get, so I hope you're wrong too.
Well, if the cdc wears a full body suit when interacting with ebola, then i guess it is contageous enough to spread quickly. I wonder how all the bugs
play into this scenario. What if a fly,mosquito,bite nats or any other kinds of bugs lands on an ebola zombie, then lands on you, then you get ebola.
The insects spreading this could spark this bug into full terror zombie apocholiptic proportions. How do they check for ebola sick sweating zombies
sweating on the planes. It dries, you touch it on the plane and BINGO, you get to be an ebola zombie spreading disease wherever you go. Mosquito bites
you and OOOPS, your a zombie. Biting fly lands and bites you and OOOPS, Nats land on you and in time you start developing a cold and rashes start to
appear and OOOPS, your a zombie. What about planes carrying mosquito's that bit ebola zombies ? What happens if it mutates and starts killing animals
like cows or pigs ? This sort of thing has happened before. The black plage killed hundreds of thousands of people and they too started to kill on
site any infected persons. BE careful, the zombies are on the loose again.
chart 7 is very informative.
you can see the curves were uniform untill June when every thing went haywire.
starting june new strains were added the ones of 2 days incubation period and 21 days incubation period.
!
where id they come from new epidemics? with new strains of Ebola.
so in June the alarm should had started and the isolation of three countries started to prevent world wide spread.
I am afraid now it is too late with the long time incubation period 21 days (may be there are ones with 40 days incubation period , who knows.
I went digging for medical research, and found that there are so many suppressed research.
a study by Zairian doctors in 1999 confirm blood donation was 80% life saving compared with 80% death with out blood donation from survivor. this study followed by so many studies I could not count refering to the blood donation (antibodies from survivors) helping not only in humans but in many animals even between species.
another study by xavier university clearly states ebola is bioweapon. and that antibodies are the best treatment.
but always some people criticizing the finding as not confirmed by scientific methodology??
kind of wasting time.
to advance medical drugs and the Takimura is actually a kind of DDT )anti RNA) just like dr Ron Paul said (was labled stupid by journalists, same journalists who did not manage to find the suppressed studies (by media of course)
ebola blood
jid.oxfordjournals.org... 1999
Treatment of Ebola Hemorrhagic Fever with Blood Transfusions from Convalescent Patients
-------
jama.jamanetwork.com...
Hemorrhagic Fever Viruses as Biological Weapons
---------
cmr.asm.org...
Passive Immunity in Prevention and Treatment of Infectious Diseases
---------------------
The potential of antibody-mediated immunity in the defence against biological weapons.
www.ncbi.nlm.nih.gov...
Antibody-mediated immunity (AMI) has been used for the treatment and prevention of infectious diseases for > 100 years, and has a remarkable record of safety, efficacy and versatility. AMI can be used for defence against a wide variety of biological weapons, and passive antibody (Ab) therapy has the potential to provide immediate immunity to susceptible individuals
----------------
Enhanced Immunological Sensitization of Mice by the Simultaneous Injection of Antigen and Specific Antiserum
I. Effect of Varying the Amount of Antigen Used Relative to the Antiserum1
www.jimmunol.org...
www.ncbi.nlm.nih.gov...
----------------
A Proposed Mechanism for Natural Immunity to Enterobacterial Pathogens
Department of Experimental Chemotherapy, Institut Pasteur, Paris, France
www.jimmunol.org...
1968!
Treatment of Gram-Negative Bacteremia and Shock with Human Antiserum to a Mutant Escherichia coli
www.nejm.org...
1
www.jimmunol.org...
www.ncbi.nlm.nih.gov...
----------------
a study shows that antibodies for a germ can help against a different Germ!!
A Proposed Mechanism for Natural Immunity to Enterobacterial Pathogens
Department of Experimental Chemotherapy, Institut Pasteur, Paris, France
www.jimmunol.org...
1968!
Treatment of Gram-Negative Bacteremia and Shock with Human Antiserum to a Mutant Escherichia coli
www.nejm.org...
---------------------
Passive transfer of antibodies protects immunocompetent and immunodeficient mice against lethal Ebola virus infection without complete inhibition of viral replication
www.ncbi.nlm.nih.gov...
------------------------------
www.ncbi.nlm.nih.gov...
Passive antibody administration (immediate immunity) as a specific defense against biological weapons.
scholar.google.com...:en-us:IE-ContextMenu&oe=&gws_rd=ssl&um=1&ie=UTF-8&lr=&cites=11246835995819184099
Viral Hemorrhagic Fevers:
Many viral agents are known to cause hemorrhagic fevers,
including Ebola, Marburg, and Junin viruses. Passive antibody
has been used for the treatment of Ebola (57), Argentine (58),
and Lassa (59) hemorrhagic fevers, with encouraging results
Furthermore, considerable evidence from animal studies indi-
cates that passive antibody administration prevents or amelio-
rates disease caused by viral agents of hemorrhagic fever (60–
63). Studies in mice suggest that the protective efficacy of pas-
sive antibody action against Ebola virus (EBOV) is a result of
suppression of viral growth that allows development of immu-
nity (60). Hyperimmune goat serum generated by immuniza-
tion with live EBOV protected guinea pigs against lethal
challenge (64). Passive antibody therapy for EBOV infection
may be effective in humans, as suggested by lower death rates
in recipients of blood transfusions from convalescent patients
(57). Two caveats in the use of passive antibody therapy with
immune sera against hemorrhagic fevers that have emerged
from studies in animal models are the existence of disease-
enhancing antibodies (65) and the need for high-titer sera to
achieve protection (66). However, problems with deleterious
antibodies and insufficient activity could potentially be
avoided by the use of MAb cocktails composed only of protec-
tive antibodies with high specific activity. In this regard,
MAbs to EBOV have been developed that are protective in
mice even when administered 2 days after infection (67).
----------
Defense against filoviruses (ebola) used as biological weapons
www.sciencedirect.com...
"The filoviruses, Marburg and Ebola, are classified as Category A biowarfare agents by the Centers for Disease Control. Most known human infections with these viruses have been fatal, and no vaccines or effective therapies are currently available. Filoviruses are highly infectious by the airborne route in the laboratory"
------------
ebola can effectively be neutralized by anti body!
www.ncbi.nlm.nih.gov...
-----
edit on 21-8-2014 by Starbucks because: (no reason given)
Ikonoclast, THANK YOU! I am the only one I know doing this stuff, to find someone who is doing it better in a way that is understandable .......
validates me. "You complete me" would be going WAY too far :-)
Sorry, must keep injecting humor into the pandemic for my own sanity, 'cause the numbers look so poor.
From a political standpoint my observation of worsening numbers followed by Ebola becoming barely a footnote in the news tweaked my radar even more. Definitely anecdotal but always thought to be part of the paradigm that the subject matter was headed in a really bad direction.
You all are more sophisticated, I just scrawled all these case and death numbers over a dozen sheets of paper and came up with a little stat I like to call dpd or deaths per day.
7/2 - 7/30 = 12.78
8/1 - 8/10 = 18.2
8/9-8/18 = 37.74
I know my sample size could be larger but just in case that last 9 day rate continues my death projection is 1006 for month of August. I hear ya Junkman and that is what concerns me, this would represent approx a nearly a threefold increase over the prior month.
Thanks again Ikon, taking the emotion out of it and making decisions based on numbers calms me. So does starting a contingency plan.
Humbly,
Lexman
a reply to: Lexman55
where can i find your work the charts? on ats?
the chart of want is a chart showing new cases by date (day of symptoms starting, or day or week case detected (but not detected that it happened two weeks ago?
. deaths are not important since are underreported.
just date of cases detected by symptoms starting would be graciously wanted.
a one epidemic should show symmetrical curves in time , but increasing in hight of curve only. usually an epidemic curves stop suddenly after 3 rd curve, unless of course unnatural modification such as airplane travel, moving patient to hospitals. or to a new city or the capital.
quarantine is for the healthy.
isolation is for the sick.
quarantine is not recommmended because one undiscovered infected person can infect all the people in quarantine because of crowding.
edit on
22-8-2014 by Starbucks because: (no reason given)
a reply to: Starbucks
Awesome research Starbucks! I saw a while back there was some success claimed by using blood from recovered patients which makes total sense but didn't know there were any studies to back it up. They just have to collect blood and sort by type to use instead of all this big pharm crap/scam.
I hope those who are inclined on this site will take these studies and broadcast them to all the media and medical hospitals possible everywhere in the world - if the media will pick it up and ask questions 'maybe' it will become a demanded treatment. If all media and hospitals become aware of them they are more likely to respond.
Cheers -
a reply to: Lexman55
Thanks, Lexman55, and you're welcome.
Your idea of calculating dpd is interesting. It's been challenging to do graphs of new cases / new deaths that are visually meaningful because WHO releases new numbers at irregular intervals. It causes gaps between data points and then a bigger bar or spike because there are more days between some reports.
Calculating the average dpd and also the average new cases reported per day between WHO reports might help get a better visual picture in the graphs. If I have time, I will try that, and credit you with the idea of course. Thanks!
originally posted by: wishes
a reply to: Starbucks
Awesome research Starbucks! I saw a while back there was some success claimed by using blood from recovered patients which makes total sense but didn't know there were any studies to back it up. They just have to collect blood and sort by type to use instead of all this big pharm crap/scam.
I hope those who are inclined on this site will take these studies and broadcast them to all the media and medical hospitals possible everywhere in the world - if the media will pick it up and ask questions 'maybe' it will become a demanded treatment. If all media and hospitals become aware of them they are more likely to respond.
Cheers -
the idea is not using blood from recovered patients! but to use antiserum from the blood of animals like Mustang and Camels.
Mustang are being slaughtered daily and sell their meat to mexican corporations for pennies on the dollar.
a one horse of those worth its weight in gold for how much passive immunity (antiserum) it can provide to humanity against deadly epidemics.
and it is sold for 10 bucks a horse, by BP to protect the endangered species (the grass and the desert turtle!)
a reply to: ikonoklast
I didn't have the data from the 19th and 20th last night. 2 days, 77 deaths
The thing that concerns me is that these charts themselves are significant. But how does one calculate the undereporting the WHO refers to? The anecdotal evidence is horrendous. i.e. Once a family member is diagnosed everyone else in the family bails so they don't get quarantined.
In the WHO article one person says 20% is a conservative estimate..... yup, VERY conservative. I am fearing two or three or four fold.
I tried to talk to a half dozen highly intelligent ppl the last 24 hours about the numbers, no one wants to deal. I guess they feel better watching ppl dump buckets of ice over their heads then thinking about what has the potential to be world changing - go figure.
I have just pulled all the suspected cases & deaths off the CDC daily reports and have listed them all out since the inception. Don't have charts. If it would help you or Starbucks for me to list it here, I'd be happy to contribute.
Peace
passive immunity (imported immunity -antibodies of serum of blood of animals) was suppressed by petrochemical industry in the 30s to give way to
petrochemical drugs and Homeopathic medicine vaccines.
first passive immunity was in 1890 (dipheteria antitoxin) way before antibiotics vaccines and most drugs.
it guarantee healing every time for every disease (infection) or non infection diseases (autoimmune diseases)
first passive immunity was in 1890 (dipheteria antitoxin) way before antibiotics vaccines and most drugs.
it guarantee healing every time for every disease (infection) or non infection diseases (autoimmune diseases)
new topics
-
Ditching physical money
History: 30 minutes ago -
One Flame Throwing Robot Dog for Christmas Please!
Weaponry: 51 minutes ago -
Don't take advantage of people just because it seems easy it will backfire
Rant: 1 hours ago -
VirginOfGrand says hello
Introductions: 1 hours ago -
Should Biden Replace Harris With AOC On the 2024 Democrat Ticket?
2024 Elections: 2 hours ago -
University student disciplined after saying veganism is wrong and gender fluidity is stupid
Education and Media: 4 hours ago -
Geddy Lee in Conversation with Alex Lifeson - My Effin’ Life
People: 6 hours ago -
God lived as a Devil Dog.
Short Stories: 6 hours ago -
Police clash with St George’s Day protesters at central London rally
Social Issues and Civil Unrest: 7 hours ago -
TLDR post about ATS and why I love it and hope we all stay together somewhere
General Chit Chat: 8 hours ago
top topics
-
Hate makes for strange bedfellows
US Political Madness: 10 hours ago, 18 flags -
Who guards the guards
US Political Madness: 13 hours ago, 13 flags -
University student disciplined after saying veganism is wrong and gender fluidity is stupid
Education and Media: 4 hours ago, 9 flags -
Police clash with St George’s Day protesters at central London rally
Social Issues and Civil Unrest: 7 hours ago, 8 flags -
TLDR post about ATS and why I love it and hope we all stay together somewhere
General Chit Chat: 8 hours ago, 7 flags -
Should Biden Replace Harris With AOC On the 2024 Democrat Ticket?
2024 Elections: 2 hours ago, 4 flags -
Has Tesla manipulated data logs to cover up auto pilot crash?
Automotive Discussion: 15 hours ago, 3 flags -
One Flame Throwing Robot Dog for Christmas Please!
Weaponry: 51 minutes ago, 2 flags -
Don't take advantage of people just because it seems easy it will backfire
Rant: 1 hours ago, 2 flags -
Geddy Lee in Conversation with Alex Lifeson - My Effin’ Life
People: 6 hours ago, 2 flags
active topics
-
Don't take advantage of people just because it seems easy it will backfire
Rant • 3 • : worldstarcountry -
One Flame Throwing Robot Dog for Christmas Please!
Weaponry • 3 • : GENERAL EYES -
Should Biden Replace Harris With AOC On the 2024 Democrat Ticket?
2024 Elections • 28 • : BernnieJGato -
Why did Phizer team with nanobot maker
Medical Issues & Conspiracies • 19 • : Zanti Misfit -
My wife just had a very powerful prophetic dream - massive war in Israel...
The Gray Area • 15 • : FlyInTheOintment -
Thousands Of Young Ukrainian Men Trying To Flee The Country To Avoid Conscription And The War
Other Current Events • 124 • : NorthOS -
Ditching physical money
History • 1 • : worldstarcountry -
University student disciplined after saying veganism is wrong and gender fluidity is stupid
Education and Media • 17 • : DBCowboy -
-@TH3WH17ERABB17- -Q- ---TIME TO SHOW THE WORLD--- -Part- --44--
Dissecting Disinformation • 632 • : daskakik -
So I saw about 30 UFOs in formation last night.
Aliens and UFOs • 43 • : DaydreamerX