It looks like you're using an Ad Blocker.
Please white-list or disable AboveTopSecret.com in your ad-blocking tool.
Thank you.
Some features of ATS will be disabled while you continue to use an ad-blocker.

No Climate Change, huh? Well, let's recap this past week's extreme weather events
page: 6share:
originally posted by: Millers
You failed to mention that the trends in both charts are smaller than the standard measurement errors.
In your second comment, you jumped straight to insinuating a motif to mislead. So far you've been the only one omitting relevant information.
If you were trying to convince me global temperatures have significantly changed by asking me just to eyeball your charts without telling me how small trends really are, then that's misleading.
There was no "gotcha". I've linked the comment because i was assuming you understand why Svalgaard rejects Lean's TSI data. Leif is convinced TSI variations only have a small effect on global temperature changes. If you accept his arguments you also have to accept his conclusions.
How much did the decrease in TSI lower the surface temperature trends?
What's the "standard measurement error" here? Yet again, you keep saying it's insignificant. Yet again, I ask you to prove it.
I insinuated a motif to mislead? The only insinuation I made was that you were careless in reading the article you quoted - something that you continue demonstrating in subsequent posts. And I've mislead people here? That's a crock - I presented evidence in this thread, and you are saying the evidence is misleading.
Just because you say something is insignificant doesn't mean it is.
Let me illustrate where that link came from for others so that everyone following this thread can have a good laugh at your expense, since you insist on continuing this idiocy. In another thread, SonOfTheLawOfOne touted a model by a guy named David Evans and mentioned Svalgaard's and credentials, since supposedly the model agrees with Svalgaard's data. This was a mistake, because as I pointed out in that thread, Leif Svalgaard looked at and quickly dismissed Evans' model. That's completely irrelevant to this topic, and it bemuses me that you are doubling down on it.
Regarding how TSI relates to surface temperature... that's a good question - one which I cannot answer at present. As I said before, it's a suggestion as to why trends were lower (but still increasing) during that period.
I really do find it amusing, that in humanity's hubris, it assumes that the planet Earth can become so destabilized, or that it is unstable to begin
with, that it will groan under the pressure of mankind, and it's creations.
Seriously?
Earth has cycles. It will always have cycles, until it's eaten by the Sun.
Seriously?
Earth has cycles. It will always have cycles, until it's eaten by the Sun.
edit on 3-8-2014 by Catacomb because: (no reason given)
a reply to: Catacomb
In the last 7 years, we've increased the atmospheric CO2 concentration from 383ppm to 400ppm - a change of more than 4%. If you deny that humans are having an impact on this world, then you are living in a fantasy world.
This change corresponds to an average of just under 19 gigatonnes of CO2 being added to the atmosphere, annually. We emit over 29 gigatonnes of CO2 annually. We are causing changes, understand this.
edit on 14Sun, 03 Aug 2014 14:41:21 -0500America/ChicagovAmerica/Chicago8 by Greven
because: (no reason given)
a reply to: Greven
You said you don't need refresher on statistical significance. Are you really sure you know what you're talking about?
No, i said your claim that your charts show a significant change in GMST is misleading. What other evidence did you present?
What's the "standard measurement error" here? Yet again, you keep saying it's insignificant. Yet again, I ask you to prove it.
Whenever we calculate a trend from a set of data, the value we obtain is an estimate. It is not a single value, but a range of possible values, some of which are more likely than others. So temperature trends are usually expressed something like this: β±ε °C/decade. β is the trend, and ε is the uncertainty. If you see a trend without an uncertainty, you should consider whether the trend is likely to be meaningful.
There is a second issue: The form β±ε °C/decade is ambiguous without an additional piece of information: the definition of uncertainty. There are two common forms. If you see an uncertainty quotes as ‘one sigma’ (1σ), then this means that according to the statistics there is a roughly 70% chance of the true trend lying between β-ε and β+ε. If you see an uncertainty quoted as ‘two sigma’ (2σ), then this means that according to the statistics there is a roughly 95% chance of the true trend lying between β-ε and β+ε. If the trend differs from some ‘null hypothesis’ by more than 2σ, then we say that the trend is statistically significant.
www.skepticalscience.com...
You said you don't need refresher on statistical significance. Are you really sure you know what you're talking about?
I presented evidence in this thread, and you are saying the evidence is misleading.
No, i said your claim that your charts show a significant change in GMST is misleading. What other evidence did you present?
originally posted by: modified device
a reply to: Rezlooper
Antarctica was a rain forest once.the climate changes,get used to it.
All the continents were once connected as a super-continent we call it Pangaea.
In other words Antarctica was closer to the equator. The continents drift, get used to it.
edit on 3-8-2014 by Grimpachi because: (no reason
given)
originally posted by: modified device
a reply to: Rezlooper
Antarctica was a rain forest once.the climate changes,get used to it.
Antarctica has been covered with ice for about 15 million years now.
You'd be better off using the Sahara Desert:
The climate of the Sahara has undergone enormous variations between wet and dry over the last few hundred thousand years.[30] This is due to a 41,000 year cycle in which the tilt of the earth changes between 22° and 24.5°.[31] At present (2000 CE), the Sahara is in a dry period, but it is expected that the Sahara will become green again in 15,000 years (17,000 CE).
Recent signals indicate that the Sahara and surrounding regions are greening because of increased rainfall. Satellite imaging shows extensive regreening of the Sahel between 1982 and 2002, and in both Eastern and Western Sahara a more than 20-year-long trend of increased grazing areas and flourishing trees and shrubs has been observed by climate scientist Stefan Kröpelin.
a reply to: eriktheawfulThanks Erictheawful....it's the tilt of the earth and the one year orbit around the sun that causes the
seasons (of the weather).As the tilt changes over 41,000 years cycle, the amount of energy from the sun changes causing changes in the seasons,
(weather) .Its all cyclic
originally posted by: Millers
You said you don't need refresher on statistical significance. Are you really sure you know what you're talking about?
No, i said your claim that your charts show a significant change in GMST is misleading.
Are you really sure you know what you're talking about?
originally posted by: Millers
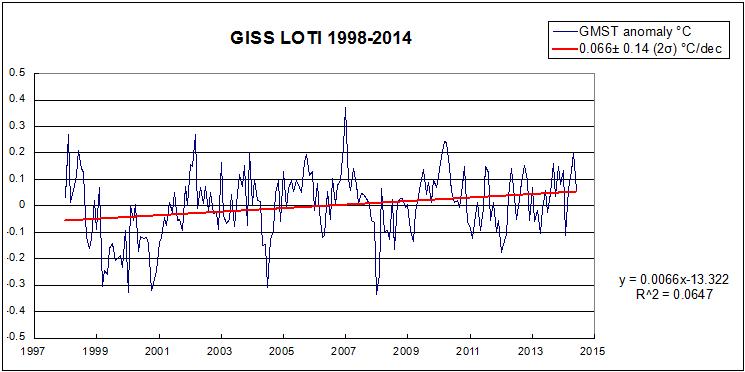
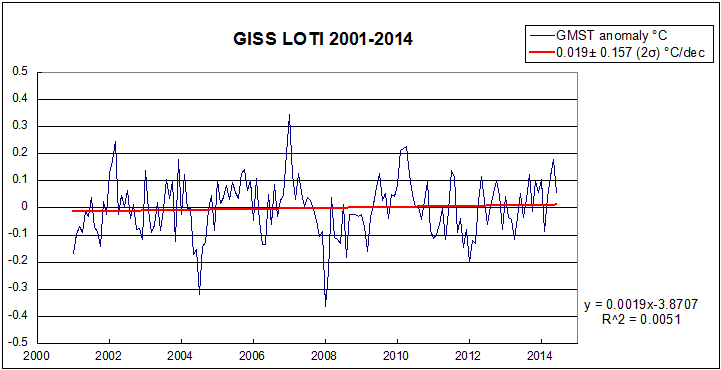
There was little change in GMST in the last 16 years and GMST trends are practically flat since the turn of the century.
originally posted by: Millers
If the trend is below 0.1 °C, it's not statistically significant.
originally posted by: Millers
I never said 0.1 °C is insignificant, i said trends below that - or changes of a few hundredths of a degree per decade - are not statistically significant.
originally posted by: Millers
The trends are too small to reject the null hypothesis (no change).
Your assertion is that the trend has been so minute that it is statistically insignificant from no change, so you must know the +/-2σ range of values in the data I am using.
What are they?
Show how they are misleading.
edit on 20Sun, 03 Aug 2014 20:38:39 -0500America/ChicagovAmerica/Chicago8 by Greven because: (no reason
given)
originally posted by: modified device
a reply to: Rezlooper
Antarctica was a rain forest once.the climate changes,get used to it.
LOL, that's your statement? Are you sticking to it? Do you really believe that humans could survive that type of change if it were to ever happen again?
a reply to: Greven
climexp.knmi.nl
You did not provide any trend estimates, standard deviations or confident intervals for your charts. You just claimed they show a real increase in GMST. Whether or not you did that on purpose, it is misleading.
When an honest man discovers he is mistaken, he will either cease being mistaken, or cease being honest.
Are you an honest man, Greven?
climexp.knmi.nl
Show how they are misleading.
You did not provide any trend estimates, standard deviations or confident intervals for your charts. You just claimed they show a real increase in GMST. Whether or not you did that on purpose, it is misleading.
When an honest man discovers he is mistaken, he will either cease being mistaken, or cease being honest.
Are you an honest man, Greven?
originally posted by: Rezlooper
a reply to: bjarneorn
I simply want to ask...do you think you could have survived that type of change, or that drastic a change? From tropics to Iceland?
I have a really nice coat. And mittens.
The climate is changing. The climate is DYNAMIC. It has ALWAYS changed. It ALWAYS will change.
We have the choice to adapt, or die. I chose to adapt. You get to make your own choice.
originally posted by: Millers
(pointless charts)
climexp.knmi.nl
You did not provide any trend estimates, standard deviations or confident intervals for your charts. You just claimed they show a real increase in GMST. Whether or not you did that on purpose, it is misleading.
When an honest man discovers he is mistaken, he will either cease being mistaken, or cease being honest.
Are you an honest man, Greven?
Good job acknowledging your screwup - er wait no you didn't at all. Yet, you proceed to lecture me about dishonesty. Hilarious... and sad.
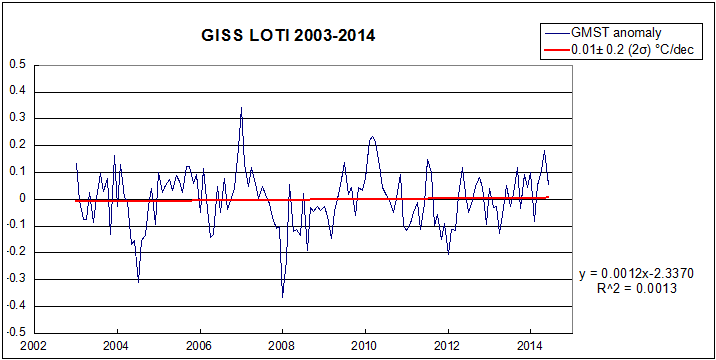
I provided the data source for those charts. You could have calculated it on your own and been done with it, but instead you keep dancing around the issue and are claiming things without actually knowing them. It seems I must be more blunt. The charts I created earlier do indeed contain 0 within two standard deviations, so you guessed right, but that doesn't mean there isn't warming, which was your assertion:
originally posted by: Millers
There was little change in GMST in the last 16 years and GMST trends are practically flat since the turn of the century.
I even explained a bit earlier. Recall the link that you posted earlier - there is a calculator on the page where you can select various date ranges. Do this for the GISTEMP data with a maximum interval of 20 years (ex. 1880-1900, 1900-1920, 1920-1940, 1940-1960, 1960-1980, 1980-2000) and you will see that within most of these ranges, there was no statistically significant warming trend. Yet, we are certainly warmer! Weird, huh?
This is because the time range is too small and the temperature range is too big, which increase the uncertainty. Another thing: of the 134 annual average temperatures from the data I used (mean = ~-0.96 and σ = 29.05), 0 are less than 2σ, 19 are between -2σ and -σ, 57 are between -σ and 0, 36 are between 0 and +σ, 13 are between +σ and +2σ, while 9 years are greater than 2σ of the mean. Those years? 1998, 2002, 2003, 2005, 2006, 2007, 2009, 2010, and 2013. Strange, all of the statistically significant years are within the last 16 years that you seem so hung up on not having warmed!
You also claim I say things that I did not. Here's what I wrote, since you seem to have forgotten:
originally posted by: Greven
Even selecting to show a minimal change shows an increase in global mean temperature.
I am not mistaken here. It is borne out in data. Yet, you replied:
originally posted by: Millers
If the trend is below 0.1 °C, it's not statistically significant.
Which is why I asked you about this:
originally posted by: Greven
Please, do explain how a change below 0.1 degrees/decade Celsius is statistically insignificant.
This has an easy answer. If it were an exam, you would have failed. A change of 0.1 degrees/decade ± 0.09 is statistically significant. A change of 0.1 degrees/decade ± 0.11 is not. Does either mean there isn't warming? Nope.
edit on 17Mon, 04 Aug 2014 17:16:10
-0500America/ChicagovAmerica/Chicago8 by Greven because: stupid error in stdev breakpoints
edit on 17Mon, 04 Aug 2014 17:19:45
-0500America/ChicagovAmerica/Chicago8 by Greven because: tag error i guess, was hiding what I wrote
a reply to: Greven
Dude, you really like it convoluted.
Where? Definitely not in the post with your charts and i can't see it in any of your other posts.
Why should i've calculated anything? You made the claim, temperatures really are increasing and your charts prove it.
But without at least showing what the trends are, no one can check if your claim is true.
The GISS maps i posted show the temperature change over the periods, it's easy to see that the trends are getting progressively smaller over time. We were never really talking about changes anywhere near 0.1°C.
Why do you even bother to post two charts, claim temperatures have increased without showing by how much and bring up the sun, when the range is too small anyways?
But it doesn't mean there is.
Do you think we are cooling, Greven?
Dude, you really like it convoluted.
I provided the data source for those charts.
Where? Definitely not in the post with your charts and i can't see it in any of your other posts.
Why should i've calculated anything? You made the claim, temperatures really are increasing and your charts prove it.
But without at least showing what the trends are, no one can check if your claim is true.
The GISS maps i posted show the temperature change over the periods, it's easy to see that the trends are getting progressively smaller over time. We were never really talking about changes anywhere near 0.1°C.
Why do you even bother to post two charts, claim temperatures have increased without showing by how much and bring up the sun, when the range is too small anyways?
Does either mean there isn't warming?
But it doesn't mean there is.
Even selecting to show a minimal change shows an increase in global mean temperature.
Do you think we are cooling, Greven?
a reply to: Millers
It's more been an issue of time, lately.
Go back and read my graphs. I know you are bad at reading things, but the source is right there. It's a URL, in black font on a white background, at the top of each graph. That way nobody (like you) can say I didn't provide the source. I'll even type out the link for you here: data.giss.nasa.gov...
Anyone who wanted to check what my charts showed could simply look at the data source itself. Don't take my word on it, look at the source - that's my philosophy. You made the claim that the trend in my chart was not statistically significant. I tried to get you to explain how you came to that conclusion. You never did. You were by correct, by chance (since you are here questioning where my source is, you obviously didn't calculate it), but also... was that word again... misleading. I wrote exactly what I claimed, and you are quite free to go back and read it once more.
You have been fooled by propaganda. Wake me when we get back below the 1950 mean.
To suggest that there are complexities in (and impacting) the environment, and to show ATS members the tricks people can play with data. People like yourself. Thanks for providing such an illustrative case study.
Wrong again. Remember how in the last post I mentioned the 9 outlying years? If 9 of the last 16 years (no wonder skeptics love this specific time span...) are the hottest years on record for the last 134 years, so much so that they are greater than two standard deviations from the mean, I'm gonna have to say it's still warming.
Remember how I said to play with that calculator? Do it again. Look at 1880-1920. Oh no, global cooling! Look at 1940-1970. Good heavens, global cooling again! Guess we must be in an ice age now, eh?
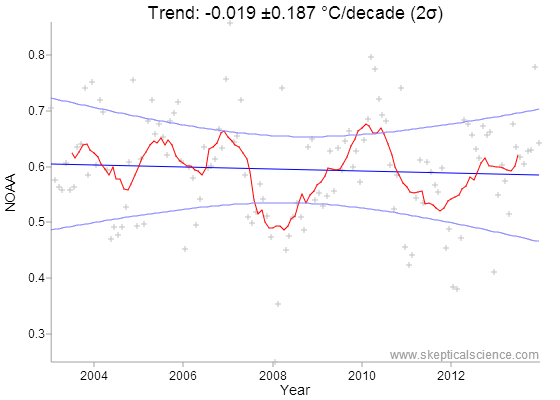
(p.s. of the 8 data sets in that calculator, 3 'show cooling' during the 2003-2014 range that you selected; NOAA being your choice there - that minority opinion sure helps your case)
It's more been an issue of time, lately.
Go back and read my graphs. I know you are bad at reading things, but the source is right there. It's a URL, in black font on a white background, at the top of each graph. That way nobody (like you) can say I didn't provide the source. I'll even type out the link for you here: data.giss.nasa.gov...
Anyone who wanted to check what my charts showed could simply look at the data source itself. Don't take my word on it, look at the source - that's my philosophy. You made the claim that the trend in my chart was not statistically significant. I tried to get you to explain how you came to that conclusion. You never did. You were by correct, by chance (since you are here questioning where my source is, you obviously didn't calculate it), but also... was that word again... misleading. I wrote exactly what I claimed, and you are quite free to go back and read it once more.
You have been fooled by propaganda. Wake me when we get back below the 1950 mean.
To suggest that there are complexities in (and impacting) the environment, and to show ATS members the tricks people can play with data. People like yourself. Thanks for providing such an illustrative case study.
Wrong again. Remember how in the last post I mentioned the 9 outlying years? If 9 of the last 16 years (no wonder skeptics love this specific time span...) are the hottest years on record for the last 134 years, so much so that they are greater than two standard deviations from the mean, I'm gonna have to say it's still warming.
Remember how I said to play with that calculator? Do it again. Look at 1880-1920. Oh no, global cooling! Look at 1940-1970. Good heavens, global cooling again! Guess we must be in an ice age now, eh?
(p.s. of the 8 data sets in that calculator, 3 'show cooling' during the 2003-2014 range that you selected; NOAA being your choice there - that minority opinion sure helps your case)
originally posted by: ChaosComplex
Do you believe that the Ice Age happened?
If you do then you also believe that the Earth can go through some radical climate changes.
originally posted by: Rezlooper
I finished writing a book called Fever Rising a couple of months ago...
Oh, I see where this is going...
originally posted by: Rezlooper
...After nearly two years of studying the issue and discussing it here at ATS, I decided it needed to be written.
Nearly two years of studying? That must have been brutal!
Humans are a mere speck on the timeline of the Earth. Written history covers an even smaller speck of our human history, and within that the weather is one of lesser recorded data. We don't know nearly enough about our planet's climate to make any sort of assumptions like this.
Now where the hell is my whiskey...
Listen…once a kid came here and started a thread about how he was tired of his long 'isolation'….and now , drumroll, he was 'going out'. I barely said anything and he went all 'value judgment' on me, my outlook, and, apparently, my overall condition/value to society. yeeesh. I had merely pointed out that being out of circulation for two weeks was hardly a thing worth beginning a thread over. But it was time, his time, and to kids a few years or weeks can seem monumental. Remember getting 'grounded', as a kid? Now Imagine how God must feel about it….time….
But yeah, looper's hungry. So was al gore. World's full of hungry people. Always with the confirmation bias, and here, with the added raw naiveté bit that exclaims 'I just wrote a book about it', it is hard to pass, on this one. Hell I'll read anything to avoid the deluge of ebola reaction threads. ebola's no fun, not after seeing the effect of Aids™ conditioning. K is for Keep your tallywacker in your pants. D is for Don't do anything not too bright. Q is for Quarantine everyone who vomits or sweats... So, I'm mainly here to observe how he reacts (given the 'in your face' intro) to the reactions. It's a study in language, style, ambition…I just don't need the rhubarb. I get it. Strike when the iron is hot etc…. The goal is to get on stage, set yourself apart from the other hungry ones. Else, the child perceives that opportunity has slipped right through the methane cracks at our feet.
I know that the first rule of the 'alphabet of success' is 'A is for Always avoid negative people'. I really don't recall the rest…all that matters is 'success'. 'S' may as well read 'S is for Strike when the iron is hot'. A sort of indoctrination we've accepted. Look at me. Look at me. He sees the weird contemporary weather reports and patterns, on his iPhone, then uses the internet to widen his scope of time and history, and decides to 'succeed'; but in accord with the rules of success, is unlikely to include any data which refutes, no matter how slightly, his position. It is, after all, the alphabet of 'success'. It's not what's right. It's who's right. Did you not read his whole OP?
# 242
edit on 5-8-2014 by TheWhiteKnight because: (no reason given)
a reply to: Greven
Why so complicated, just link to the data next time. Putting the URL on your charts doesn't show what the estimated trends are. If you would've provided that information with your charts, everybody could see there was little change in the last 16 years and flat trends for this century.
Isn't it misleading to leave out information that could prove your claim is not true?
I showed you the trends are not statistically significant, but it was your job to test for significance and report the results along with your charts.
Are you friends with Matthew England, Greven?
If someone like him can come to terms with reality, it shouldn't be that hard for you.
After you have convinced people that you believe your cause to be more important than telling the truth, you've lost the power to convince them of anything else.
Why so complicated, just link to the data next time. Putting the URL on your charts doesn't show what the estimated trends are. If you would've provided that information with your charts, everybody could see there was little change in the last 16 years and flat trends for this century.
Isn't it misleading to leave out information that could prove your claim is not true?
You made the claim that the trend in my chart was not statistically significant.
I showed you the trends are not statistically significant, but it was your job to test for significance and report the results along with your charts.
You have been fooled by propaganda.
Are you friends with Matthew England, Greven?
There are people actually out there trying to say that the IPCC has overstated or overestimated climate change. This report shows very clearly that the projections have occurred.(...)
And so anybody out there lying that the IPCC projections are overstatements or that the observations haven't kept pace with the projections is completely offline with this. The analysis is very clear that the IPCC projections are coming true.
M. England 2012
Despite ongoing increases in atmospheric greenhouse gases, the Earth’s global average surface air temperature has remained more or less steady since 2001.
M. England 2013
If someone like him can come to terms with reality, it shouldn't be that hard for you.
I insinuated a motif to mislead? The only insinuation I made was that you were careless in reading the article you quoted ...
To suggest that there are complexities in (and impacting) the environment, and to show ATS members the tricks people can play with data. People like yourself.
After you have convinced people that you believe your cause to be more important than telling the truth, you've lost the power to convince them of anything else.
new topics
-
George Knapp AMA on DI
Area 51 and other Facilities: 3 hours ago -
Not Aliens but a Nazi Occult Inspired and then Science Rendered Design.
Aliens and UFOs: 3 hours ago -
Louisiana Lawmakers Seek to Limit Public Access to Government Records
Political Issues: 6 hours ago -
The Tories may be wiped out after the Election - Serves them Right
Regional Politics: 7 hours ago -
So I saw about 30 UFOs in formation last night.
Aliens and UFOs: 9 hours ago -
Do we live in a simulation similar to The Matrix 1999?
ATS Skunk Works: 10 hours ago -
BREAKING: O’Keefe Media Uncovers who is really running the White House
US Political Madness: 10 hours ago -
Biden--My Uncle Was Eaten By Cannibals
US Political Madness: 11 hours ago -
"We're All Hamas" Heard at Columbia University Protests
Social Issues and Civil Unrest: 11 hours ago
top topics
-
BREAKING: O’Keefe Media Uncovers who is really running the White House
US Political Madness: 10 hours ago, 23 flags -
George Knapp AMA on DI
Area 51 and other Facilities: 3 hours ago, 18 flags -
Biden--My Uncle Was Eaten By Cannibals
US Political Madness: 11 hours ago, 18 flags -
African "Newcomers" Tell NYC They Don't Like the Free Food or Shelter They've Been Given
Social Issues and Civil Unrest: 17 hours ago, 12 flags -
"We're All Hamas" Heard at Columbia University Protests
Social Issues and Civil Unrest: 11 hours ago, 7 flags -
Louisiana Lawmakers Seek to Limit Public Access to Government Records
Political Issues: 6 hours ago, 7 flags -
Russian intelligence officer: explosions at defense factories in the USA and Wales may be sabotage
Weaponry: 16 hours ago, 6 flags -
So I saw about 30 UFOs in formation last night.
Aliens and UFOs: 9 hours ago, 5 flags -
The Tories may be wiped out after the Election - Serves them Right
Regional Politics: 7 hours ago, 3 flags -
Not Aliens but a Nazi Occult Inspired and then Science Rendered Design.
Aliens and UFOs: 3 hours ago, 3 flags
active topics
-
-@TH3WH17ERABB17- -Q- ---TIME TO SHOW THE WORLD--- -Part- --44--
Dissecting Disinformation • 531 • : cherokeetroy -
Biden--My Uncle Was Eaten By Cannibals
US Political Madness • 41 • : Halfswede -
So I saw about 30 UFOs in formation last night.
Aliens and UFOs • 20 • : Halfswede -
Candidate TRUMP Now Has Crazy Judge JUAN MERCHAN After Him - The Stormy Daniels Hush-Money Case.
Political Conspiracies • 375 • : WeMustCare -
MULTIPLE SKYMASTER MESSAGES GOING OUT
World War Three • 33 • : Halfswede -
George Knapp AMA on DI
Area 51 and other Facilities • 12 • : theshadowknows -
Not Aliens but a Nazi Occult Inspired and then Science Rendered Design.
Aliens and UFOs • 7 • : JonnyC555 -
Mood Music Part VI
Music • 3057 • : BatCaveJoe -
The Tories may be wiped out after the Election - Serves them Right
Regional Politics • 19 • : alwaysbeenhere2 -
"We're All Hamas" Heard at Columbia University Protests
Social Issues and Civil Unrest • 125 • : KrustyKrab