It looks like you're using an Ad Blocker.
Please white-list or disable AboveTopSecret.com in your ad-blocking tool.
Thank you.
Some features of ATS will be disabled while you continue to use an ad-blocker.

No Climate Change, huh? Well, let's recap this past week's extreme weather events
page: 5share:
originally posted by: Dfairlite
I love that the AGW apologists don't even know what AGW is. Global warming is a rise in the average temperature of the earth. This means local weather events don't matter much. But record cold summers across an area as vast as the USA requires the rest of the world to be a little warmer than average or another, similarly sized area to be enduring a record hot summer.
Further more, tornadoes have been on the decline (fewer every year) just like most extreme weather events. Warmer weather is better for the human race than cooler weather.
But don't let that get in the way of wishing we caused the earth to warm by burning fossil fuels. Now roll down your windows and blast the AC, gotta do your part
The Earth hasn't warmed in 17 years. Has actually gotten cooler over the last ten years. Arctic ice was at record levels. We're close to turning our heat on in July where I live.
a reply to: jjkenobi
Do you know the difference between the Arctic and Antarctic?
Because the only records being broken for Arctic Ice has been the record lows.
Here let me show you.
The question that matters as far as Ice is, is the world gaining Ice losing Ice or are levels staying the same?
If you can answer that question then you should have your answer of if the world is warming.
Very rarely does not obviously mean never. The simple fact is if you live where you get thunderstorms you can get a tornado. Also please be aware that
climate change is over long periods of time that changes the normal climate . Over time. It's not evident in extreme events that occasionally occur.
Your examples are not indicative of climate change. Also you should be aware that most of the argument is not whether weather changes but the actual
cause of the change. Since we all know that the earth has gone through drastic changes in the past no one can argue that it doesn't happen. It's the
cause people disagree with. I personally don't see mankind as the cause and look to cycles that the planet will normally go through. o reply to:
Rezlooper
originally posted by: AngryCymraeg
originally posted by: pikestaff
originally posted by: NoRulesAllowed
originally posted by: lonweld
The OP sounds a lot like Al Gore telling us the ice caps in the arctic will be melted by 2014......
The funny thing is, the ice caps ARE melting. Deny what's in front of your own eyes?
What Al Gore said or predicted is irrelevant. Look at FACTS, and do yourself a favor and at least try to see the climate change debate without a bias. The climate doesn't care about political parties. LOOK AT FACTS.
I am reminded of a news story earlier this year of a guy in a sail boat trying to sail through the north west passage had to be rescued as his boat got stuck fast in the ice!
According to reports in climate depot, Antarctic sea ice is at its greatest extent since records began, and its been growing year on year.
There has been temperature change for the last sixteen years, so ice melt mystifies me.
I'm sorry, but no. The temperature has not been stuck for the past 16 years, it's rising. The oceans are getting hotter and hotter and it's having an impact on the poles. The glaciers of Antarctica are moving faster and it's actually snowing again in some parts. I know that last part sounds bleeding obvious but it's not - parts of the South Pole actually classify as being desert due to the minimal amount of precipitation that falls on those parts, as it's literally too cold to snow there. That's now changing - it's warming.
Hi AngryCymraeg,
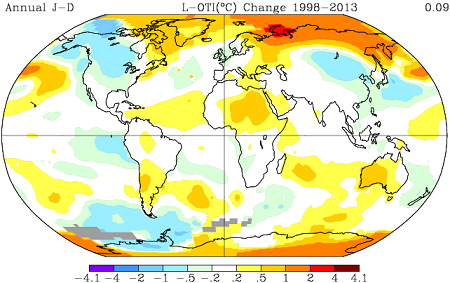
It's not entirely clear to me to what "temperature" you're referring to. In the context of the post you replied to, i think it would be global mean surface temperature.
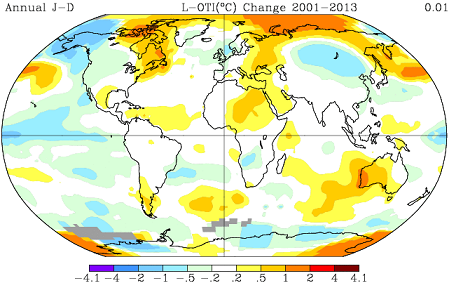
There was little change in GMST in the last 16 years and GMST trends are practically flat since the turn of the century.
You say the oceans are getting hotter and hotter, and again i'm not sure if you mean sea surface temperatures or ocean heat content.
There are better tools to display the spatial patterns of SST trends, but since the data sets would be the same i'll stick with GISS maps for consistency.
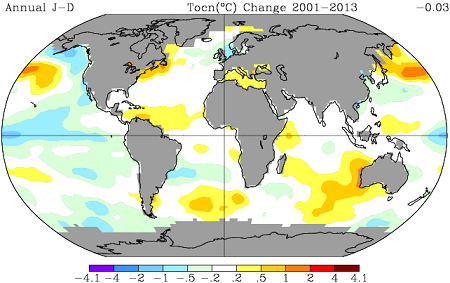
That leaves ocean heat content. I don't think it is possible to understand or discuss the complex nature of ocean mean volume temperature changes, without at least some back-round knowledge of the challenges involved to detect these changes. But if i take your statement literally, then no the ocean are not getting hotter and hotter.
Here some excerpts from a recent paper (still in print) where these challenges are discussed, plus some deep ocean cooling.
The major observational obstacle to understanding the role of the ocean in climate is the extreme brevity of the instrumental record in a system having some memory exceeding several thousands of years. Data sets depicting the global interior ocean state begin with high accuracy altimetry only in 1992.
The Argo array became quasi-global in the mid-2000s. Assuming that these technologies continue to be supported (by no means clear), the community will ultimately have comparatively long records at least of the phenomena visible in upper-ocean hydro-graphic profiles and sea surface elevation.
The globally integrated heat content changes involve small differences of the much larger regional changes. As existing estimates of the anthropogenic forcing are now about 0.5W/m2, the equivalent global ocean average temperature changes over 20 years are mostly slight compared to the shorter term temporal variations from numerous physical sources. Detailed attention must be paid to what might otherwise appear to be small errors in data calibration, and space-time sampling and model biases.
Direct determination of changes in oceanic heat content over the last 20 years are not in conflict with estimates of the radiative forcing, but the uncertainties remain too large to rationalize e.g., the apparent “pause” in warming.
ocean.mit.edu...
You don't really explain how, you think, the oceans are affecting Antarctica, but you make it sound as if something extraordinary is happening. It is true that the precipitation that does accrue there is projected to increase in future, but up until now there has been very little change.
Global climate models suggest that Antarctic snowfall should increase in a warming climate and mitigate rises in the sea level. Several processes affect surface mass balance (SMB), introducing large uncertainties in past, present and future ice sheet mass balance. To provide an extended perspective on the past SMB of Antarctica, we used 67 firn/ice core records to reconstruct the temporal variability in the SMB over the past 800 yr and, in greater detail, over the last 200 years.
The temporal and spatial variability of the SMB over the previous 800 yr indicates that SMB changes over most of Antarctica are statistically negligible and do not exhibit an overall clear trend.
This result is in accordance with the results presented by Monaghan et al. (2006), which demonstrate statistically insignificant changes in the SMB over the past 50 yr. However, a clear increase in accumulation of more than 10 % (> 300 kg m−2 yr−1) has occurred in high-SMB coastal regions and over the highest part of the East Antarctic ice divide since the 1960s.
The decadal records of previous centuries show that the observed increase in accumulation is not anomalous at the continental scale, that high-accumulation periods also occurred during the 1370s and 1610s, and that the current SMB is not significantly different from that over the last 800 yr.
www.the-cryosphere.net...
I don't know if the information presented here can change your mind, but if you truly believe something "unprecedented" is happening with climate system, maybe it is time to check again.
all the best
data.giss.nasa.gov...
www.climate4you.com...
originally posted by: Millers
There was little change in GMST in the last 16 years and GMST trends are practically flat since the turn of the century.
Really?
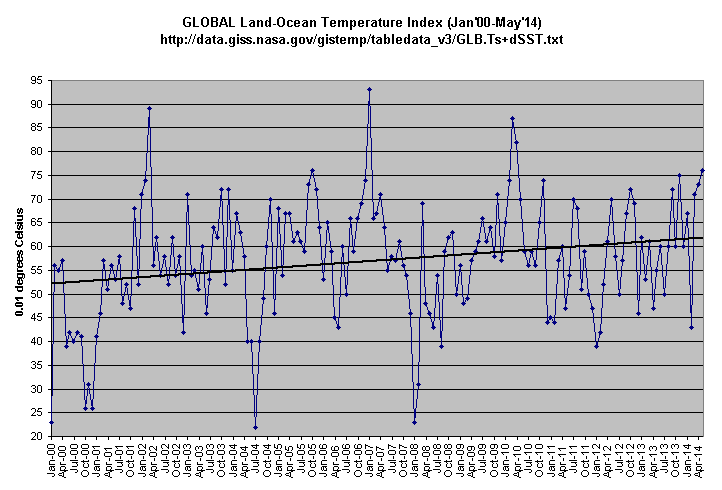
Also, note how different the trend is when one selects a specific range purposely to show a lower trend, from the exact same data set.

Even selecting to show a minimal change shows an increase in global mean temperature.
Also, keep in mind that this increase happened during a deep solar minimum, when the Sun is outputting less energy and hence the total solar irradiance received by the Earth is less.
edit on 13Thu, 31 Jul 2014 13:35:35 -0500America/ChicagovAmerica/Chicago7 by Greven because: (no reason given)
a reply to: Greven
Really.
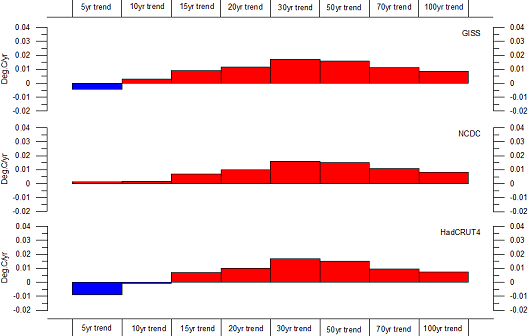
Check the "display equation" box for the trends in your spreadsheet. If the trend is below 0.1 °C, it's not statistically significant. You'd have to go back almost 20 years for that.
I made no statement as to why the trends are flat, but Leif and quit a few climate scientists would disagree with you that TSI is to blame here.
Really.
For this period, the observed trend of 0.05 ± 0.08 °C per decade is more than four times smaller than the average simulated trend of 0.21 ± 0.03 °C per decade. It is worth noting that the observed trend over this period — not significantly different from zero — suggests a temporary ‘hiatus’ in global warming.
www.see.ed.ac.uk...
Check the "display equation" box for the trends in your spreadsheet. If the trend is below 0.1 °C, it's not statistically significant. You'd have to go back almost 20 years for that.
I made no statement as to why the trends are flat, but Leif and quit a few climate scientists would disagree with you that TSI is to blame here.
originally posted by: Millers
Really.
...
If the trend is below 0.1 °C, it's not statistically significant. You'd have to go back almost 20 years for that.
...
I made no statement as to why the trends are flat, but Leif and quit a few climate scientists would disagree with you that TSI is to blame here.
Read the paper better:
Global mean surface temperature over the past 20 years (1993–2012) rose at a rate of 0.14 ± 0.06 °C per decade (95% confidence interval). This rate of warming is significantly slower than that simulated by the climate models
Please, do explain how a change below 0.1 degrees/decade Celsius is statistically insignificant. You are aware that the difference between global temperatures during an ice age and modern global temperatures is approximately 5 degrees Celsius, no?
They can disagree all they want, but it doesn't mean they're right. Nor does it mean I am. However, it seems to me that, based on the historical record and logic, that a decrease in energy output of the Sun would mean less energy is reaching the Earth to warm it. Of course, if the Earth isn't losing heat at a faster rate than it is gaining it, it's going to stay the same or keep warming at a slower rate.
Sea level rise drives nuisance
flooding higher in US coastal cities
I know, I know...I'm sure it's all "made up" data to push an agenda.
I know, I know...I'm sure it's all "made up" data to push an agenda.
originally posted by: Greven
originally posted by: Millers
Really.
...
If the trend is below 0.1 °C, it's not statistically significant. You'd have to go back almost 20 years for that.
...
I made no statement as to why the trends are flat, but Leif and quit a few climate scientists would disagree with you that TSI is to blame here.
Read the paper better:
Global mean surface temperature over the past 20 years (1993–2012) rose at a rate of 0.14 ± 0.06 °C per decade (95% confidence interval). This rate of warming is significantly slower than that simulated by the climate models
Please, do explain how a change below 0.1 degrees/decade Celsius is statistically insignificant. You are aware that the difference between global temperatures during an ice age and modern global temperatures is approximately 5 degrees Celsius, no?
They can disagree all they want, but it doesn't mean they're right. Nor does it mean I am. However, it seems to me that, based on the historical record and logic, that a decrease in energy output of the Sun would mean less energy is reaching the Earth to warm it. Of course, if the Earth isn't losing heat at a faster rate than it is gaining it, it's going to stay the same or keep warming at a slower rate.
In the context of the post you replied to, i think it would be global mean surface temperature.
If a statistic is significantly different from zero at the (p) 0.05 level, then the 95% confidence interval will not contain zero.
en.wikipedia.org...
your link
originally posted by: Millers
In the context of the post you replied to, i think it would be global mean surface temperature.
en.wikipedia.org...
your link
...And their warming "rate of 0.14 ± 0.06 °C per decade" is significant. So, what?
I don't need a refresher on what it means - I want you to explain how 0.1 degree Celsius is insignificant. Recall, you had written that there was "little change in GMST," presumably based off that paper you quoted with (no confidence interval, so I assume it's standard deviation instead of standard error) a standard deviation larger than the mean: "observed trend of 0.05 ± 0.08 °C per decade." While it's certainly possible to have a standard deviation larger than the mean, it means that the data set they are using has large fluctuations in the set and/or that it is limited in size. For example, the hypothetical series [0.00,0.01,0.02,0.03,0.2] produces a mean of ~0.052 and a standard deviation of ~0.083. Repeating this same series 20 times for a total of 100 set members keeps the mean the same, but reduces the standard deviation to ~0.075.
Ah yes, my link from another thread entirely, which was in response to someone who claimed Leif Svalgaard's credentials and data supported a model of global cooling by Evans. The link in question is a response to that specific model by Svalgaard. Context is important, as is reading. Regardless, look at the image he posted. Again, context is important here. On the chart it doesn't look particularly deep, but over the last 125 years, TSI has been within a (sometimes reconstructed) range of about 1360.3 to 1362.2 Watt/m^2. The low point of Svalgaard's chart is 1360.5 Watt/m^2. Moreover, this past dip is stretched out over a longer period than is recorded/reconstructed in that same 125 years. The Sun operates on an "11-year cycle" which can actually be 9 to 14 years. The midpoint between the 'peak' (this can fluctuate and generate several different peaks and small valleys) prior to the low point of 2008-2009 is in 2003 (can't see this on Svalgaard's chart, as the 'peak' was in 2001). The midpoint between the low point of 2008 and next 'peak' is in 2011. Around 8 years separate the two midpoints, which is not something we've seen in the last century, so far as I am aware. It's typically 5-6 years.
a reply to: Greven
You're not making much sense. I never said 0.1 °C is insignificant, i said trends below that - or changes of a few hundredths of a degree per decade - are not statistically significant.
You brought up TSI. You said the sun is in a deep solar minimum, whatever that means, and that's why the trends are so small.
I want you to explain how 0.1 degree Celsius is insignificant.
You're not making much sense. I never said 0.1 °C is insignificant, i said trends below that - or changes of a few hundredths of a degree per decade - are not statistically significant.
You brought up TSI. You said the sun is in a deep solar minimum, whatever that means, and that's why the trends are so small.
This is complete nonsense. Here is TSI since 2003. There is no such drop. If anything TSI is now higher than it were in 2003.
edit on 1-8-2014 by Millers because: a-men
originally posted by: Greven
Even selecting to show a minimal change shows an increase in global mean temperature.
Surface temperature, that is. More importantly when you look at ocean heat content---as oceans have a substantial heat capacity this should be a better "physical integrator" and less influenced by observational fluctuations---you find new warming.
What appears to be happening is that the ENSO (El-Nino Southern Oscillation) cycle appears to have been more biased recently towards "La Nina" conditions, meaning that the surface is less hot and the heat more advected downward. It's possible that this bias or change may also be influenced by effects from global warming, more Arctic freshwater from melts.
www.skepticalscience.com...
In particular, look at Fig 3 and Fig 5.
PS: The early 90's dip in Fig 3 was from the eruption of Mt Pinatubo (which confirmed many of the climate models at the time and convinced almost all of the legitimate climate research community about the predictions from global warming from increased greenhouse emissions, by early 90's it was case closed on the main effect).
This is yet another example why complex science is best done by the professionals who have worked on it for their careers.
Similarly, changes in the combined ocean/air circulation results in more winds which advect heat down the oceans.
newsroom.unsw.edu.au...
The strengthening of the Pacific trade winds began during the 1990s and continues today. Previously, no climate models have incorporated a trade wind strengthening of the magnitude observed, and these models failed to capture the hiatus in warming. Once the trade winds were added by the researchers, the global average temperatures very closely resembled the observations during the hiatus.
judithcurry.com...
thinkprogress.org...
And then there's the observational problem in the surface records reconstruction---fix this and the 'pause' goes away.
www.realclimate.org...
In sum, when you actual follow the details of the science you find:
* ocean/air processes have been in a phase taking more heat from the surface down to the oceans
* the oceans are measured to be taking the heat
* the surface temperature reconstructions had some tricky methodological problems because of a lack of stations in the Arctic (where warming is the fastest)
and when you try to fix/understand these problems you find that there is no unexplained paused in global warming.
a reply to: mbkennel
Hi mbkennel,
The article on J.Curry's blog you linked to, makes exactly the point that is disputed in the skepticalscience post.
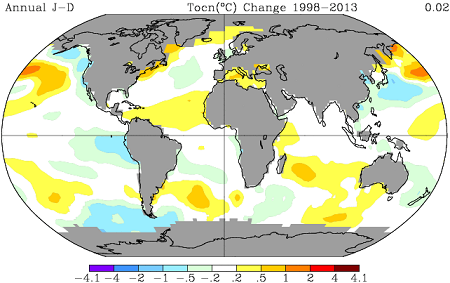
Ocean heat content data for the last decade (Argo era) show that the entire Pacific (top 700m) has lost heat. The heat loss is most pronounced in the tropical Pacific, exactly where the largest heat increase would be expected.
Both NOAA and GISS constantly "fix" their surface temperature records and they would strongly disagree that the data sets have methodological problems that would significantly alter the results.
www1.ncdc.noaa.gov...
data.giss.nasa.gov...
The Met-Office still uses the original HadCRUT4 data.
Cowtan and Way's HadCRUT hybrid is warm-biased compared to the three official surface temperature products, but it also shows a trend that is four times smaller than projected since the early 2000's.
None of the points you've summarized at the end of post holds up under scrutiny and really explains the small recent trends. It is equally possible that the warming contribution from man-made greenhouse gases has been simply overestimated.
Hi mbkennel,
The article on J.Curry's blog you linked to, makes exactly the point that is disputed in the skepticalscience post.
A common belief in the climate establishment is that El Niño – La Niña sequences will eventually balance out over long periods of time, and warming due to greenhouse gases will be the dominant trend over longer periods of time. However, when one actually examines the data, one finds that the El Niños and La Niñas were not in balance during the 20th century.
judithcurry.com...
Similarly, changes in the combined ocean/air circulation results in more winds which advect heat down the oceans.
The Walker circulation (or Walker cell) which normally – through easterly trade winds – leads to the accumulation of warm tropical waters in the West Pacific (compensated by higher-altitude winds blowing back from West to East) has been weakening in the past 60 years.
www.bitsofscience.org...
The immediate cause of this slowdown, however, continued to puzzle climate scientists. They could not reproduce the weakening consistently in global atmospheric models, questioning the ability of climate models to simulate the observed gradual climate change. At the root of the models’ failure, Tokinaga suspected, was the lack of precise sea surface temperature (SST) data used to drive the models.
iprc.soest.hawaii.edu...
Model experiments with this trend pattern robustly simulate the observed changes, including the Walker circulation slowdown and the eastward shift of atmospheric convection from the Indonesian maritime continent to the central tropical Pacific. Our results cannot establish whether the observed changes are due to natural variability or anthropogenic global warming, but they do show that the observed slowdown in the Walker circulation is presumably driven by oceanic rather than atmospheric processes.
www.nature.com...(paywalled)
Ocean heat content data for the last decade (Argo era) show that the entire Pacific (top 700m) has lost heat. The heat loss is most pronounced in the tropical Pacific, exactly where the largest heat increase would be expected.
And then there's the observational problem in the surface records reconstruction---fix this and the 'pause' goes away.
Both NOAA and GISS constantly "fix" their surface temperature records and they would strongly disagree that the data sets have methodological problems that would significantly alter the results.
www1.ncdc.noaa.gov...
data.giss.nasa.gov...
The Met-Office still uses the original HadCRUT4 data.
Cowtan and Way's HadCRUT hybrid is warm-biased compared to the three official surface temperature products, but it also shows a trend that is four times smaller than projected since the early 2000's.
None of the points you've summarized at the end of post holds up under scrutiny and really explains the small recent trends. It is equally possible that the warming contribution from man-made greenhouse gases has been simply overestimated.
originally posted by: Millers
You're not making much sense. I never said 0.1 °C is insignificant, i said trends below that - or changes of a few hundredths of a degree per decade - are not statistically significant.
You brought up TSI. You said the sun is in a deep solar minimum, whatever that means, and that's why the trends are so small.
You can say whatever you want. Back it up. Do you know what the entire range of the Northern Hemisphere mean temperature was from a reconstruction stretching between 0 AD to just before the depths of the Little Ice Age (around 1500 AD)? About 1 degrees Celsius, using 5-year averages. With the Little Ice Age? A bit more than 1.2 degrees Celsius. Including up to the last few years? About 1.9 degrees Celsius.
I did bring up TSI, but I did not write that the Sun is in a deep solar minimum, right now. Again, context is important. I wrote that "this increase happened during a deep solar minimum" - happened being past-tense for a reason. With a link that shows the time frame for even more precise context. If you don't know what that a term means, look it up.
originally posted by: mbkennel
and when you try to fix/understand these problems you find that there is no unexplained paused in global warming.
Okay? I was illustrating in the graph you quoted how people can play with perceptions based on purposely skewing data in certain ways, though.
edit on 12Sat, 02 Aug 2014 12:50:24 -0500America/ChicagovAmerica/Chicago8 by Greven because: (no reason given)
a reply to: Greven
There is nothing more to back up. The trends are too small to reject the null hypothesis (no change).
I still don't really get what your point is. If you wanna argue GMST has changed significantly, then you need to show how. The charts you posted aren't really helping your argument.
Did you bring up TSI as a possible explanation or do you have real numbers that show by how much surface temperatures are affected?
edit on 2-8-2014 by Millers because: extra DIV
a reply to: Millers
I know precisely what a null hypothesis means. You keep saying it's insignificant, too small, etc. I do not trust your assertion, based on your behavior (such as digging up an irrelevant post in another thread entirely as a 'gotcha' because you couldn't read properly what was written).
I've shown you that the entire 5-year average temperature variation range in the northern hemisphere over 2000 years, from 0AD to the past few years, is about 1.9 degrees Celsius. You've declared a trend below 0.1 degrees Celsius (with that break point being >5%) over the course of a decade (a time period of 0.5%) to be insignificant. That's your limit - explain why you've arrived at this conclusion.
The second graph is an illustration of purposeful distortion, based on picking and choosing points such that the trend will appear very small - something the skeptic camp is rather fond of doing (ex: picking the start point in August and the end point in February using northern hemisphere data is going to show a decrease in temperature). Even then, there is an increasing trend.
Yes, I am suggesting that TSI is not irrelevant to global temperatures. Beginning in about 2003, TSI declined up until about 2009, when it started to increase again. That's a big chunk of the 16/17/20 whatever years of 'no global warming.' Considering how often skeptics cite the Sun as being the primary driver of Earth's temperature, I find it amusing that you seem to dismiss this.
Oh well, perhaps I'm the only one who sees some relationship between the two:
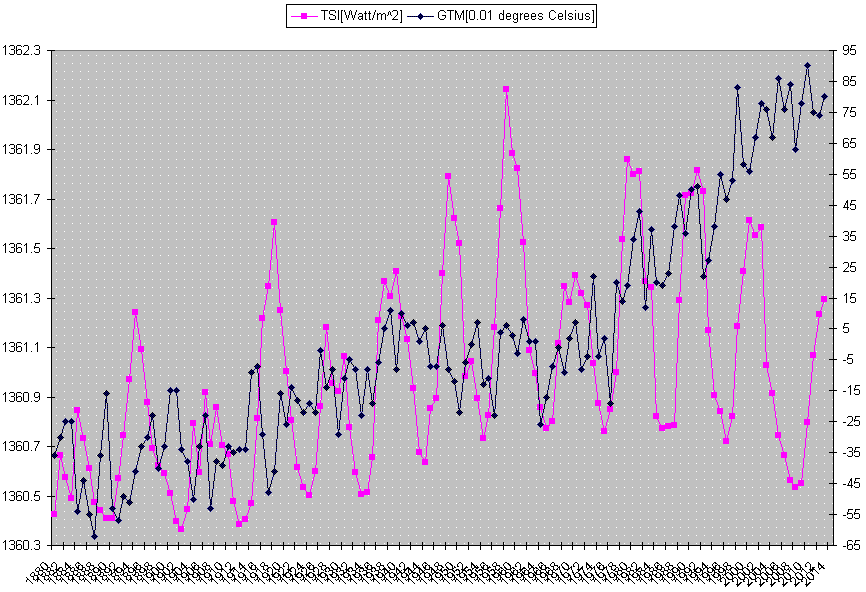
(please note that TSI has only been accurately measured in recent years, and much of this chart is a reconstruction)
I know precisely what a null hypothesis means. You keep saying it's insignificant, too small, etc. I do not trust your assertion, based on your behavior (such as digging up an irrelevant post in another thread entirely as a 'gotcha' because you couldn't read properly what was written).
I've shown you that the entire 5-year average temperature variation range in the northern hemisphere over 2000 years, from 0AD to the past few years, is about 1.9 degrees Celsius. You've declared a trend below 0.1 degrees Celsius (with that break point being >5%) over the course of a decade (a time period of 0.5%) to be insignificant. That's your limit - explain why you've arrived at this conclusion.
The second graph is an illustration of purposeful distortion, based on picking and choosing points such that the trend will appear very small - something the skeptic camp is rather fond of doing (ex: picking the start point in August and the end point in February using northern hemisphere data is going to show a decrease in temperature). Even then, there is an increasing trend.
Yes, I am suggesting that TSI is not irrelevant to global temperatures. Beginning in about 2003, TSI declined up until about 2009, when it started to increase again. That's a big chunk of the 16/17/20 whatever years of 'no global warming.' Considering how often skeptics cite the Sun as being the primary driver of Earth's temperature, I find it amusing that you seem to dismiss this.
Oh well, perhaps I'm the only one who sees some relationship between the two:
(please note that TSI has only been accurately measured in recent years, and much of this chart is a reconstruction)
a reply to: Greven
I can not know what's going inside your head. In your first reply, you've posted two charts and a link to an article about the present weak solar cycle. Apart from a one word comment, you did not explain what your first chart is supposed to show. You failed to mention that the trends in both charts are smaller than the standard measurement errors.
In your second comment, you jumped straight to insinuating a motif to mislead. So far you've been the only one omitting relevant information.
If you were trying to convince me global temperatures have significantly changed by asking me just to eyeball your charts without telling me how small trends really are, then that's misleading.
There was no "gotcha". I've linked the comment because i was assuming you understand why Svalgaard rejects Lean's TSI data. Leif is convinced TSI variations only have a small effect on global temperature changes. If you accept his arguments you also have to accept his conclusions.
There is nothing for me to dismiss. How much did the decrease in TSI lower the surface temperature trends? I can't tell from your chart.
a reply to: pavil
Direct surface temperature measurements from the high Arctic region are rare. GISS uses extrapolated data from surface stations within distance (250 km or 1200 km) to fill in grids with missing data.
 GISS: smoothing radius 250km
Researchers often use reanalysis "data" to estimate trends for the region, but there is an ongoing debate about the reliability of the various reanalysis products.
I don't know what's going there. Any answer i could give you would be speculation.
What do you think?
Direct surface temperature measurements from the high Arctic region are rare. GISS uses extrapolated data from surface stations within distance (250 km or 1200 km) to fill in grids with missing data.
Researchers often use reanalysis "data" to estimate trends for the region, but there is an ongoing debate about the reliability of the various reanalysis products.
I don't know what's going there. Any answer i could give you would be speculation.
What do you think?
new topics
-
Ditching physical money
History: 2 hours ago -
One Flame Throwing Robot Dog for Christmas Please!
Weaponry: 2 hours ago -
Don't take advantage of people just because it seems easy it will backfire
Rant: 3 hours ago -
VirginOfGrand says hello
Introductions: 4 hours ago -
Should Biden Replace Harris With AOC On the 2024 Democrat Ticket?
2024 Elections: 4 hours ago -
University student disciplined after saying veganism is wrong and gender fluidity is stupid
Education and Media: 7 hours ago -
Geddy Lee in Conversation with Alex Lifeson - My Effin’ Life
People: 8 hours ago -
God lived as a Devil Dog.
Short Stories: 8 hours ago -
Police clash with St George’s Day protesters at central London rally
Social Issues and Civil Unrest: 10 hours ago -
TLDR post about ATS and why I love it and hope we all stay together somewhere
General Chit Chat: 11 hours ago
top topics
-
Hate makes for strange bedfellows
US Political Madness: 13 hours ago, 20 flags -
Who guards the guards
US Political Madness: 15 hours ago, 13 flags -
University student disciplined after saying veganism is wrong and gender fluidity is stupid
Education and Media: 7 hours ago, 12 flags -
Police clash with St George’s Day protesters at central London rally
Social Issues and Civil Unrest: 10 hours ago, 9 flags -
TLDR post about ATS and why I love it and hope we all stay together somewhere
General Chit Chat: 11 hours ago, 7 flags -
Should Biden Replace Harris With AOC On the 2024 Democrat Ticket?
2024 Elections: 4 hours ago, 5 flags -
Has Tesla manipulated data logs to cover up auto pilot crash?
Automotive Discussion: 17 hours ago, 3 flags -
One Flame Throwing Robot Dog for Christmas Please!
Weaponry: 2 hours ago, 3 flags -
God lived as a Devil Dog.
Short Stories: 8 hours ago, 3 flags -
Don't take advantage of people just because it seems easy it will backfire
Rant: 3 hours ago, 3 flags
active topics
-
Joe Biden Just Lost A Primary Election To A Man Nobody Heard Of Until A Minute Ago
2024 Elections • 18 • : WeMustCare -
Remember These Attacks When President Trump 2.0 Retribution-Justice Commences.
2024 Elections • 48 • : fringeofthefringe -
Breaking Baltimore, ship brings down bridge, mass casualties
Other Current Events • 470 • : IndieA -
Should Biden Replace Harris With AOC On the 2024 Democrat Ticket?
2024 Elections • 38 • : Lumenari -
One Flame Throwing Robot Dog for Christmas Please!
Weaponry • 5 • : nugget1 -
Hate makes for strange bedfellows
US Political Madness • 37 • : YourFaceAgain -
Candidate TRUMP Now Has Crazy Judge JUAN MERCHAN After Him - The Stormy Daniels Hush-Money Case.
Political Conspiracies • 742 • : Annee -
Ditching physical money
History • 11 • : BernnieJGato -
1980s Arcade
General Chit Chat • 24 • : 5thHead -
Don't take advantage of people just because it seems easy it will backfire
Rant • 4 • : VirginOfGrand