It looks like you're using an Ad Blocker.
Please white-list or disable AboveTopSecret.com in your ad-blocking tool.
Thank you.
Some features of ATS will be disabled while you continue to use an ad-blocker.

NOAA/NASA Caught With Their Pants Down On Global Warming Numbers...
page: 21share:
CO2 emissions are a major problem because they are the product of combustion.
Let a vital chemical in your body experienced in 40% in a very short amount of time, do you think your body would simply adapt?
This planet has vital signs. CO2 is one of many.
Let a vital chemical in your body experienced in 40% in a very short amount of time, do you think your body would simply adapt?
This planet has vital signs. CO2 is one of many.
edit on 3-7-2014 by jrod because: Science is not a cult following
originally posted by: jrod
a reply to: raymundoko
It is you who is demanding a college dropout to have a PHD understanding in this, when you have yet to demonstrate an undergraduate understanding of this subject.
While you are an excellent debater, it does not change any facts.
I have referenced 3 PHDs in this subject and crunched some numbers so this board is clear how I derive my numbers. I am a numbers kind of person.
It appears that the 40% rise of CO2 concentrations, 280ppm was the pre industrial era count. Now we are at 400ppm. It also appears we are currently experiencing a 20ppm rise in CO2 per decade......
www.esrl.noaa.gov...
JRod, I can't take this nonsense you are spewing any longer. Ray, myself and several other posters have provided you with evidence that DIRECTLY contradicts your arguments and claims. I won't argue your level of intelligence because that would be presumptuous of me, but I will argue your level of maturity because that, you have demonstrated. You might be a smart person, but you are allowing your maturity and emotions on this subject to get the best of you.
So, since you are all about numbers and facts and what not, you can show everyone on this thread your excellent knowledge and counter-arguments to these facts, just like you've asked from everyone else. I'm not asking you for any calculations, I'm simply presenting you with facts that you can choose to ignore. I caution you, that by ignoring them, and not countering them with something of substance other than asking for a residence time calculation, you are going to demonstrate your credibility and maturity once and for all.
#1 - 280ppm for pre-industrial CO2 has been proven to be inaccurate. The 280ppm you keep referring to was taken from ice cores which is clearly stated on the source you provided multiple times and I pointed out to you in one of my previous posts. Are you aware that additional CO2 records exists from plant stomata? Probably not, because if you were, you would realize that most of the ice cores (with the slight exception of the Law Dome) only give us a precision of time of about 100 years, at best 40-50 years, while plant stomata can provide a higher resolution, usually within a tolerance of a decade. The other data sources introduce what people like to call "noise". However, this is a major problem because you don't throw out higher-resolution time-sensitive data just because it's noisy in your result set.
There is a lot that can happen with the climate in 100 years. If you are ONLY looking at ice cores which give an AVERAGE number for CO2 count in a multi-decade window, yet CO2 can rise and fall several times within that time, how does that accurately represent CO2 in between the 100 year windows? Please read the paper from Van Hoof, et al. 2005 for more direct information regarding the differences in these cycles and measurements if you decide to question it.
Please keep in mind... ice cores aren't a "measurement" of anything direct. I said it before, and I will say it again so that you clearly understand. An ice core, from anywhere in the world, is an inferred measurement of the CO2 that was present, in the air at the surface, when it was trapped by the ice. They are an indicator for CO2 at the surface near the ice, NOT the entire planet. Even with multiple ice cores from around the world, there is a large disparity in the data, so when that happens, they throw out the data from one core and take from another so that it supports the model they are trying to create. Standard signal theory tells us that movements of 30-40 ppmv in CO2 over periods less than 60-or-so years cannot be accurately resolved in the DE08 ice core.
So as an example, let's say that day 1 we are at 280ppm, and 20 years later, CO2 goes up 50ppm and stays there for 10 years before taking 20 years to return back to 280ppm. That is NOT considered "stable" pre-industrial CO2, it is a flaw in how we measure and derive the values and this has been completely ignored, even in the face of being admitted by the people who use the ice cores. The smoothing that is used, throws out the highs and lows, which are important when trying to determine how CO2 fluctuates over time, and how sensitive it is year-over-year to changes.
With statistics, you NEVER EVER smooth on a time series because you LOSE DATA RESOLUTION and automatically end up using an average, which excludes the highs and lows. This is the fundamental problem with historical CO2 from ice cores, and why you are fooled into believing that CO2 is "stable" at 280ppm before the 1800's. Ice cores are great if you are looking for a loose average but not high-precision details. This is what the pre-industrial measurement is derived from, is the smoothing of those numbers.
Once you smooth the numbers our and exclude the high and low swings, you get a nice "steady" number. And then you build computer models off of it. And then they are wrong EVERY SINGLE TIME and constantly have to be tweaked. Except that they tweak the model, not improve the accuracy of the data in it. Fatal flaw in climate science and data modeling, of which, I have an advanced degree and work in the field of the latter, so tread carefully if you are going to challenge me on that.
Proof from your own source in the post above (and again, READ the words carefully because they are contextually sensitive given the data):
This figure shows the atmospheric increase of CO2 over 280 ppm in weekly averages of CO2 observed at Mauna Loa. The value of 280 ppm is chosen as representative of pre-industrial air because it is close to the average of CO2 measured and dated with high time resolution between the years 1000 and 1800 in an ice core from Law Dome, Antarctica. [Etheridge et al., 1996]
When you include the stomata data that so many AGW proponents choose to ignore, and include GEOCARB data, it becomes very clear that 280ppm is wrong and likely "off" by 30-45ppm. You keep mentioning 3 PhDs that support your arguments, but that is hearsay from you unless they have published a paper that says otherwise. Just because a group of people widely accept it, does not make it so or cause it to become fact. Evidence and reproduction of the data from multiple sources is what turns it from theory to fact.
#2 - Temperature increases before CO2 does. Originally, with the hockey stick images everyone saw, the belief was that CO2 increased before temperature, which made everyone believe that we are all going to die from high temperatures and the ice caps would melt BECAUSE of the CO2. It's very easy to Google this and you'll find tons and tons of journals, papers and articles that easily demonstrate this.
It has since been determined, that in MOST cases where have enough DATA to support it, temperature increases first. That means that a potential cause for the outgassing of CO2 from all of the sinks is likely from the temperature increasing.
Just these two pieces of information, are enough to dispute your claims that we are in some type of imminent danger, and that 280ppm is even accurate. Need time to talk to someone and get your facts together? That's fine, I'll be patiently waiting.
~Namaste
So the 40% is now not true because you say so?
What argument and claims are you referring to that you have debunked? Please show math or sources that show observed data. A bunch of links only proves someone has an agenda to push.
Cite me a PHD who is an expert in the field of atmospheric chemistry who will dispute the 280ppm, 400pp, and 20ppm/decade rise we are currently observing.
This is not a debate, science is not decided by who wins a debate.
edit on 3-7-2014 by jrod because: elementary tactic to quote a grammatical
error in an effort to discredit
Right, all things I've already said in this thread...
The papers and IPCC report both show a distinct lack of anthropogenic co2 isotopes in the atmosphere. Why? That's the question and exactly what the papers are attempting to explain.
a reply to: yorkshirelad
The papers and IPCC report both show a distinct lack of anthropogenic co2 isotopes in the atmosphere. Why? That's the question and exactly what the papers are attempting to explain.
a reply to: yorkshirelad
originally posted by: redtic
Yeah, full disclosure - I'm not an expert on climate science. And I'm going to go out on a limb and say neither are you. I base what I believe on what a consensus of scientists is telling us - and, yes, there is a consensus. You, you believe what you say because, I don't know, Rush told you so? There's probably been thousands of global warming threads where the graphs, links, etc have been posted by both sides, so that really doesn't matter any more - it all comes down to - why do you believe what you believe? What has taken you there? For me, logic dictates over emotion. Don't even tell me there's a consensus that is anti-global warming, because there isn't. If that were the case, that would likely be my course. But it's not, and therefore it isn't.
Therein lies the problem, the majority of the AGW crowd BELIEVE in AGW "because that's what some scientists are telling us". People like you do not base your opinion on evidence but just on "belief", this is what makes AGW the religion of the late 20th century and the beginning of the 21st century...
You see, you should do some real research on AGW instead of basing your opinion "on belief"... Is this what you call science?... To believe what the AGW scientist proponents claim?...
Here are some of the things your AGW scientists have been doing meanwhile people like you, a majority of the AGW crowd, keep basing your opinion on "believing" the lies of the AGW scientists...
The following shows the messed up mentality of today's environmentalists and AGW believers.
EXPLODING SCHOOL CHILDREN : Global Warming Propaganda Campaign Backfires
And let's not forget...
A BRITISH climate scientist at the centre of a controversy over leaked emails is facing fresh claims that he sought to hide problems in temperature data on which his work was based.
An investigation of more than 2000 emails apparently hacked from the University of East Anglias climatic research unit has found evidence that a series of measurements from Chinese weather stations was seriously flawed.
.....
www.theage.com.au...
And there is more to the story.
Climate scientist Phil Jones and a collaborator have been accused of scientific fraud for attempting to suppress data that could cast doubt on a key 1990 study on the effect of cities on warming.
Dr Jones withheld the information requested under British freedom of information laws. Subsequently a senior colleague told him he feared that Dr Jones collaborator, Wei-chyung Wang of the University at Albany, had ''screwed up''.
The apparent attempts to cover up problems with temperature data from the Chinese weather stations provide the first link between the email scandal and the UN's embattled climate science body, the Intergovernmental Panel on Climate Change, as a paper based on the measurements was used to bolster IPCC statements about rapid global warming in recent decades.
www.theage.com.au...
And more...
The IPCC has already been criticised for its use of information that had not been rigorously checked - in particular a false claim that all Himalayan glaciers could melt by 2035.
Of 105 freedom of information requests to the University of East Anglia over the climatic research unit, which Dr Jones led until the end of December, only 10 had been released in full.
www.theage.com.au...
When the news broke, and Jones, and the IPCC top brass decided to pass the fault to one man only the scientists which was accused told what happened...
The scientist behind the bogus claim in a Nobel Prize-winning UN report that Himalayan glaciers will have melted by 2035 last night admitted it was included purely to put political pressure on world leaders.
Dr Murari Lal also said he was well aware the statement, in the 2007 report by the Intergovernmental Panel on Climate Change (IPCC), did not rest on peer-reviewed scientific research.
.........
www.dailymail.co.uk...
edit on 3-7-2014 by ElectricUniverse because: to add link.
Dude, seriously???
It certainly isn't right because YOU say so. I just wrote a whole post explaining to you why 280ppm is inaccurate, and it's not disputed that it is inaccurate. There is no WAY you understand statistics if you are going to argue that time-sensitive data, that aims to establish high and low variations, should be smoothed to show an average over that time. Ask yourself why the data is thrown-out. As Ray already pointed out, the percentage of the carbon isotope that represents human emissions is not 40%, so a large part of the increase is from natural sources too.
All you've done is push a link from NOAA and name drop your 3 PhDs while claiming that it's science, with not a SINGLE paper to back up what you are saying. I've read every post of yours, and in between "residence time calculation" and "source: Cosmos", there's nothing else but dribble and constant strawman tactics.
I've cited specific papers, so has Ray. You've ignored them. That's your choice, and an ignorant one at that. I read your source, did you read ours?
I've shown you, virtually spelling it out for you, how numbers are being manipulated and the inaccuracy that it creates in the models used for predicting the climate.
HERE is the link to the RAW data from the Law Dome, where you can see for yourself, that the further you go back in time, the larger the gaps are between measurements, clearly demonstrating that when you plot two dots on a graph that are 100 years apart and draw a line between them, it makes it look nice and smooth compared to when the same line has 100 dots, 1 for every year, showing high and low fluctuations. You are completely ignoring even the raw data, which so many other scientists have recognized as being flawed.
Now why would I do that? So that you can further try to diminish the credibility of someone else's work? So that you can argue how the paper is wrong, and Cosmos is right? Or how your link above to NOAA is "FACT" as you like to say it, yet ironically, the OP's article SHOWS CLEARLY that they had their hand in the cookie jar, changing data? I don't need to give you a PhD paper for you to go look at the raw data and see for yourself what I'm talking about.
Can you prove that CO2 stayed constant at 280ppm? You can't, because the records show spikes all over the place, some as high as 600ppm, so good luck with that. The only paper used that cites 270-280ppm is written in 1983 by Wigley, who just happened to head the CRU - the same group that was caught lying about the data in the ClimateGate scandal, which nobody has defended because they flat out lied and admitted it. How convenient that the paper was written by the same person who was at the top of the same group involved in ClimateGate.
There are tons of inconsistencies that have been shown in the conversion of gas in the ice cores during sublimation and contamination of the ice. There are detailed chemical records during the 1800's from scientists that are WELL documented, showing major gas variations all over the world. (not just CO2, but CO4 and Nitrogen as well)
There is no "proof" because we don't have direct written measurements that pre-date the 19th century. Everything before that is from tree rings, ice cores, plant stomata, rocks, etc. None of them are even remotely close to 100% accurate, and that is why it's such a major flaw in the climate models being used. It's truly "best guess" estimates in light of not having written records more than 200 years old. That is not nearly enough time to accumulate data on a planet's climate using our techniques and instruments that we have today, let alone in the past.
In many of the posts by Ray and myself and others, there have been sources cited. The work of Van Hoof, Dr. Zbiegniew Jaworowski and Ernst Georg Beck provide PLENTY for you to read through to show that there is strong enough evidence for inaccurate and cherry-picked data by Wigley and Callendar. Go Google them, pick your source.
You have not yet once come back with a valid argument against the sources, just regurgitation of the same silly comments with not a shred of evidence to back it up other than "it's widely accepted". "The earth is flat"... was widely accepted... "witches are real"... was widely accepted... is that your only evidence? Why won't you just read what we've provided and come back with a reasonable argument?
Science is not decided by wide acceptance and consensus either. It is through experimentation and observation that leads to predictions that can be proven repeatedly. Global warming is still a theory, let's make that distinction very clear. There is no "settled science" as long as you have groups of scientists who keep opposing and presenting evidence that contradicts the claims.
Countless times, "laws" of physics and long-standing ideologies have been challenged and proven to be wrong, after being "widely accepted" or deemed true "by consensus". Everyone agreed that the Earth was flat. By your standards, it should be a FACT still. Yet, someone challenged it and it was PROVEN wrong, even though the ESTABLISHED, AGREED UPON AND CONSENSUS VIEW fought tirelessly that the proof was wrong when the evidence was staring them in the face.
“The essence of propaganda consists in winning people over to an idea so sincerely, so vitally, that in the end they succumb to it utterly and can never again escape from it.”
Goebbels.
In case you don't know who Goebbels is, he was the Nazi's master of propaganda and was damn good at it. Do you honestly think that you can't be the victim of propaganda and an agenda?
Like I said before, whatever helps you sleep better at night.
~Namaste
originally posted by: jrod
So the 40% is now not true because you say so?
It certainly isn't right because YOU say so. I just wrote a whole post explaining to you why 280ppm is inaccurate, and it's not disputed that it is inaccurate. There is no WAY you understand statistics if you are going to argue that time-sensitive data, that aims to establish high and low variations, should be smoothed to show an average over that time. Ask yourself why the data is thrown-out. As Ray already pointed out, the percentage of the carbon isotope that represents human emissions is not 40%, so a large part of the increase is from natural sources too.
What argument and claims are you referring to that you have debunked? Please show math or sources that show observed data. A bunch of links only proves someone has an agenda to push.
All you've done is push a link from NOAA and name drop your 3 PhDs while claiming that it's science, with not a SINGLE paper to back up what you are saying. I've read every post of yours, and in between "residence time calculation" and "source: Cosmos", there's nothing else but dribble and constant strawman tactics.
I've cited specific papers, so has Ray. You've ignored them. That's your choice, and an ignorant one at that. I read your source, did you read ours?
I've shown you, virtually spelling it out for you, how numbers are being manipulated and the inaccuracy that it creates in the models used for predicting the climate.
HERE is the link to the RAW data from the Law Dome, where you can see for yourself, that the further you go back in time, the larger the gaps are between measurements, clearly demonstrating that when you plot two dots on a graph that are 100 years apart and draw a line between them, it makes it look nice and smooth compared to when the same line has 100 dots, 1 for every year, showing high and low fluctuations. You are completely ignoring even the raw data, which so many other scientists have recognized as being flawed.
Cite me a PHD who is an expert in the field of atmospheric chemistry who will dispute the 280ppm, 400pp, and 20ppm/decade rise we are currently observing.
Now why would I do that? So that you can further try to diminish the credibility of someone else's work? So that you can argue how the paper is wrong, and Cosmos is right? Or how your link above to NOAA is "FACT" as you like to say it, yet ironically, the OP's article SHOWS CLEARLY that they had their hand in the cookie jar, changing data? I don't need to give you a PhD paper for you to go look at the raw data and see for yourself what I'm talking about.
Can you prove that CO2 stayed constant at 280ppm? You can't, because the records show spikes all over the place, some as high as 600ppm, so good luck with that. The only paper used that cites 270-280ppm is written in 1983 by Wigley, who just happened to head the CRU - the same group that was caught lying about the data in the ClimateGate scandal, which nobody has defended because they flat out lied and admitted it. How convenient that the paper was written by the same person who was at the top of the same group involved in ClimateGate.
There are tons of inconsistencies that have been shown in the conversion of gas in the ice cores during sublimation and contamination of the ice. There are detailed chemical records during the 1800's from scientists that are WELL documented, showing major gas variations all over the world. (not just CO2, but CO4 and Nitrogen as well)
There is no "proof" because we don't have direct written measurements that pre-date the 19th century. Everything before that is from tree rings, ice cores, plant stomata, rocks, etc. None of them are even remotely close to 100% accurate, and that is why it's such a major flaw in the climate models being used. It's truly "best guess" estimates in light of not having written records more than 200 years old. That is not nearly enough time to accumulate data on a planet's climate using our techniques and instruments that we have today, let alone in the past.
In many of the posts by Ray and myself and others, there have been sources cited. The work of Van Hoof, Dr. Zbiegniew Jaworowski and Ernst Georg Beck provide PLENTY for you to read through to show that there is strong enough evidence for inaccurate and cherry-picked data by Wigley and Callendar. Go Google them, pick your source.
You have not yet once come back with a valid argument against the sources, just regurgitation of the same silly comments with not a shred of evidence to back it up other than "it's widely accepted". "The earth is flat"... was widely accepted... "witches are real"... was widely accepted... is that your only evidence? Why won't you just read what we've provided and come back with a reasonable argument?
This is not a debate, science is not decided by who wins a debate.
Science is not decided by wide acceptance and consensus either. It is through experimentation and observation that leads to predictions that can be proven repeatedly. Global warming is still a theory, let's make that distinction very clear. There is no "settled science" as long as you have groups of scientists who keep opposing and presenting evidence that contradicts the claims.
Countless times, "laws" of physics and long-standing ideologies have been challenged and proven to be wrong, after being "widely accepted" or deemed true "by consensus". Everyone agreed that the Earth was flat. By your standards, it should be a FACT still. Yet, someone challenged it and it was PROVEN wrong, even though the ESTABLISHED, AGREED UPON AND CONSENSUS VIEW fought tirelessly that the proof was wrong when the evidence was staring them in the face.
“The essence of propaganda consists in winning people over to an idea so sincerely, so vitally, that in the end they succumb to it utterly and can never again escape from it.”
Goebbels.
In case you don't know who Goebbels is, he was the Nazi's master of propaganda and was damn good at it. Do you honestly think that you can't be the victim of propaganda and an agenda?
Like I said before, whatever helps you sleep better at night.
~Namaste
edit on 3-7-2014 by SonOfTheLawOfOne because: (no reason given)
edit on 3-7-2014 by SonOfTheLawOfOne because: (no reason
given)
Then there are the several instances when CRU, and even NASA under the direction of Hansen have tampered with data, or published errors as proof just
to try to back their AGW religion..
Such as...
blogs.telegraph.co.uk... ta-to-exaggerate-global-warming/
BTW, the use of the word "believe" is not based on religion, but on the fact that the Russians think that the CRU tampered with the Russian data on purpose to try to back their AGW religion. It wasn't a mistake...
Every time Hansen, the CRU and the rest of the AGW are caught in lies they claim, alongside their believers, that it was just an error...
It wasn't an error, CRU cherry picked what data to use meanwhile they decided not to include the data from a majority of the stations which showed that the Russian meteorological-station data did not substantiate the AGW theory.
And that wasn't the only time when CRU, and other AGW scientists have tampered with the data...
Such as...
...
Climategate has already affected Russia. On Tuesday, the Moscow-based Institute of Economic Analysis (IEA) issued a report claiming that the Hadley Center for Climate Change based at the headquarters of the British Meteorological Office in Exeter (Devon, England) had probably tampered with Russian-climate data.
The IEA believes that Russian meteorological-station data did not substantiate the anthropogenic global-warming theory. Analysts say Russian meteorological stations cover most of the country's territory, and that the Hadley Center had used data submitted by only 25% of such stations in its reports. Over 40% of Russian territory was not included in global-temperature calculations for some other reasons, rather than the lack of meteorological stations and observations.
The data of stations located in areas not listed in the Hadley Climate Research Unit Temperature UK (HadCRUT) survey often does not show any substantial warming in the late 20th century and the early 21st century.
The HadCRUT database includes specific stations providing incomplete data and highlighting the global-warming process, rather than stations facilitating uninterrupted observations.
On the whole, climatologists use the incomplete findings of meteorological stations far more often than those providing complete observations.
...
blogs.telegraph.co.uk... ta-to-exaggerate-global-warming/
BTW, the use of the word "believe" is not based on religion, but on the fact that the Russians think that the CRU tampered with the Russian data on purpose to try to back their AGW religion. It wasn't a mistake...
Every time Hansen, the CRU and the rest of the AGW are caught in lies they claim, alongside their believers, that it was just an error...
It wasn't an error, CRU cherry picked what data to use meanwhile they decided not to include the data from a majority of the stations which showed that the Russian meteorological-station data did not substantiate the AGW theory.
And that wasn't the only time when CRU, and other AGW scientists have tampered with the data...
The following fact was discovered by Roger Pielke Jr, a professor of environmental studies at the Center for Science and Technology Policy Research at
the University of Colorado at Boulder.
In the following excerpt and link Pielke starts by writing about Steve McIntyre's determination to probe and investigate the data released by the scientific community regarding AGW. Pielke Jr goes on to write that supposedly back in the 90s the atmospheric sciences community decided to ensure that all the data would be made openly available for research purposes, which is why the World Meteorological Organization was founded.
Pielke Jr. continues by explaining that resolution 40 states, and I quote:
rogerpielkejr.blogspot.com...
But agencies like CRU, among others have been hard at work on doing the opposite trying to restrict and even stop the data from being investigated by independent researchers and scientists. Pielke Jr. goes on to say;
rogerpielkejr.blogspot.com...
That's more evidence of the lies that the AGW scientists keep trying to push on people to make them, alongside world governments accept their extremist policies; not to mention their push to make people believe in their AGW religion, which will do more harm than good.
In the following excerpt and link Pielke starts by writing about Steve McIntyre's determination to probe and investigate the data released by the scientific community regarding AGW. Pielke Jr goes on to write that supposedly back in the 90s the atmospheric sciences community decided to ensure that all the data would be made openly available for research purposes, which is why the World Meteorological Organization was founded.
Pielke Jr. continues by explaining that resolution 40 states, and I quote:
...
Members should provide to the research and education communities, for their non-commercial activities, free and unrestricted access to all data and products exchanged under the auspices of WMO . . .
rogerpielkejr.blogspot.com...
But agencies like CRU, among others have been hard at work on doing the opposite trying to restrict and even stop the data from being investigated by independent researchers and scientists. Pielke Jr. goes on to say;
...
Thus it is with some surprise to observe CRU going through bizarre contortions to avoid releasing its climate data to Steve McIntyre. They first told him that he couldn't have it because he was not an academic. I found this to be a petty reason for keeping data out of the hands of someone who clearly wants to examine it for scholarly purposes. So, wanting to test this theory I asked CRU for the data myself, being a "real" academic. I received a letter back from CRU stating that I couldn't have the data because "we do not hold the requested information."
I found that odd. How can they not hold the data when they are showing graphs of global temperatures on their webpage? However, it turns out that CRU has in response to requests for its data put up a new webpage with the following remarkable admission (emphasis added):
We are not in a position to supply data for a particular country not covered by the example agreements referred to earlier, as we have never had sufficient resources to keep track of the exact source of each individual monthly value. Since the 1980s, we have merged the data we have received into existing series or begun new ones, so it is impossible to say if all stations within a particular country or if all of an individual record should be freely available. Data storage availability in the 1980s meant that we were not able to keep the multiple sources for some sites, only the station series after adjustment for homogeneity issues. We, therefore, do not hold the original raw data but only the value-added (i.e. quality controlled and homogenized) data.
Say what?! CRU has lost track of the original data that it uses to create its global temperature record!? Can this be serious? So not only is it now impossible to replicate or reevaluate homogeneity adjustments made in the past -- which might be important to do as new information is learned about the spatial representativeness of siting, land use effects, and so on -- but it is now also impossible to create a new temperature index from scratch. CRU is basically saying, "trust us." So much for settling questions and resolving debates with empirical information (i.e., science).
...
rogerpielkejr.blogspot.com...
That's more evidence of the lies that the AGW scientists keep trying to push on people to make them, alongside world governments accept their extremist policies; not to mention their push to make people believe in their AGW religion, which will do more harm than good.
edit on 3-7-2014 by ElectricUniverse because: correct error
originally posted by: defcon5
originally posted by: FarleyWayne
IN CASE YOU MISSED IT ... ( March 2007 )
Warming On Jupiter, Mars, Pluto, Neptune's Moon & Earth Linked to Increased Solar Activity, Scientists Say
To my knowledge, that's been disproven:
It wasn't disproven. You just need to understand what the graph shows and what has actually been happening.
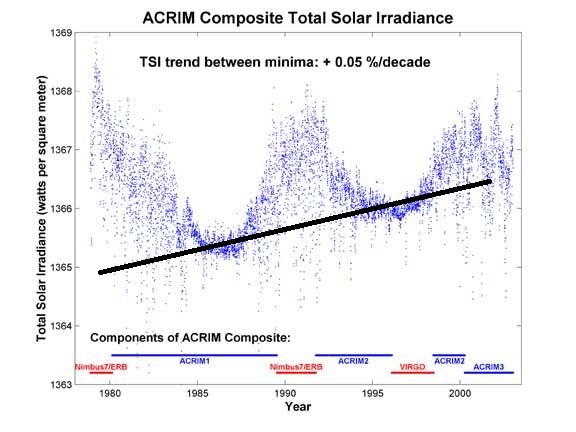
Research by Wilson who is a researcher affiliated with NASA's Goddard Institute for Space Studies and Columbia University's Earth Institute, New York., found an increasing trend in total solar irradiance, during times of quiet sunspot activity, of 0.05% per decade in the 24 years covered by his research.
This particular research started in 1978, and ended in 2002, and until that last year Wilson found the increase in solar irradiance.
NASA Study Finds Increasing Solar Trend That Can Change Climate
Mar. 20, 2003
Since the late 1970s, the amount of solar radiation the sun emits, during times of quiet sunspot activity, has increased by nearly .05 percent per decade, according to a NASA funded study.
"This trend is important because, if sustained over many decades, it could cause significant climate change," said Richard Willson, a researcher affiliated with NASA's Goddard Institute for Space Studies and Columbia University's Earth Institute, New York. He is the lead author of the study recently published in Geophysical Research Letters.
...
In order to investigate the possibility of a solar trend, Willson needed to put together a long-term dataset of the sun's total output. Six overlapping satellite experiments have monitored TSI since late 1978. The first record came from the National Oceanic and Atmospheric Administration's (NOAA) Nimbus7 Earth Radiation Budget (ERB) experiment (1978 - 1993). Other records came from NASA's Active Cavity Radiometer Irradiance Monitors: ACRIM1 on the Solar Maximum Mission (1980 - 1989), ACRIM2 on the Upper Atmosphere Research Satellite (1991 - 2001) and ACRIM3 on the ACRIMSAT satellite (2000 to present). Also, NASA launched its own Earth Radiation Budget Experiment on its Earth Radiation Budget Satellite (ERBS) in 1984. The European Space Agency's (ESA) SOHO/VIRGO experiment also provided an independent data set (1996 to 1998).
In this study, Willson, who is also Principal Investigator of NASA's ACRIM experiments, compiled a TSI record of over 24 years by carefully piecing together the overlapping records. In order to construct a long-term dataset, he needed to bridge a two-year gap (1989 to 1991) between ACRIM1 and ACRIM2. Both the Nimbus7/ERB and ERBS measurements overlapped the ACRIM 'gap.' Using Nimbus7/ERB results produced a 0.05 percent per decade upward trend between solar minima, while ERBS results produced no trend. Until this study, the cause of this difference, and hence the validity of the TSI trend, was uncertain. Willson has identified specific errors in the ERBS data responsible for the difference. The accurate long-term dataset, therefore, shows a significant positive trend (.05 percent per decade) in TSI between the solar minima of solar cycles 21 to 23 (1978 to present). This major finding may help climatologists to distinguish between solar and man-made influences on climate.
NASA's ACRIMSAT/ACRIM3 experiment began in 2000 and will extend the long-term solar observations into the future for at least a five-year minimum mission.
Reference
Willson, R.C., and A.V. Mordvinov 2003. Secular total solar irradiance trend during solar cycles 21-23. Geophys. Res. Lett. 30, no. 5, 1199, doi:10.1029/2002GL016038.
www.giss.nasa.gov...
That research study only covered 24 years, from 1978, until 2002, but we also know that the strength of Solar magnetic storms had been increasing until around the end of 2005-2006, and after this the Sun's activity dropped to a crawl and we saw a global temperature drop right after the Sun's activity began to slow down.
BTW, of note is the fact that the Earth's magnetic field has been weakening since around 1840.
Magnetic Field Weakening in Stages, Old Ships' Logs Suggest
John Roach
for National Geographic News
May 11, 2006
Earth's magnetic field is weakening in staggered steps, a new analysis of centuries-old ships logs suggests.
The finding could help scientists better understand the way Earth's magnetic poles reverse.
The planet's magnetic field flips—north becomes south and vice versa—on average every 300,000 years. However, the actual time between reversals varies widely.
The field last flipped about 800,000 years ago, according to the geologic record.
Since 1840, when accurate measures of the intensity were first made, the field strength has declined by about 5 percent per century.
news.nationalgeographic.com...
Anyway, other research has shown that the Sun's activity had been increasing for decades until at least the end of the 1970s. Putting these facts, alongside what Wilson's research found together it should be easy to understand that the Sun, alongside other activities occurring in our solar system and outside it, have been the mayor causes for Climate Change on Earth.
Total solar irradiance, during times of quiet sunspot activity had been increasing.
[atsimg]http://files.abovetopsecret.com/images/member/5821619030e4.jpg[/atsimg]
Notice in the above graph the incline in TSI during times of quiet sunspot activity.
Here, let me help you.
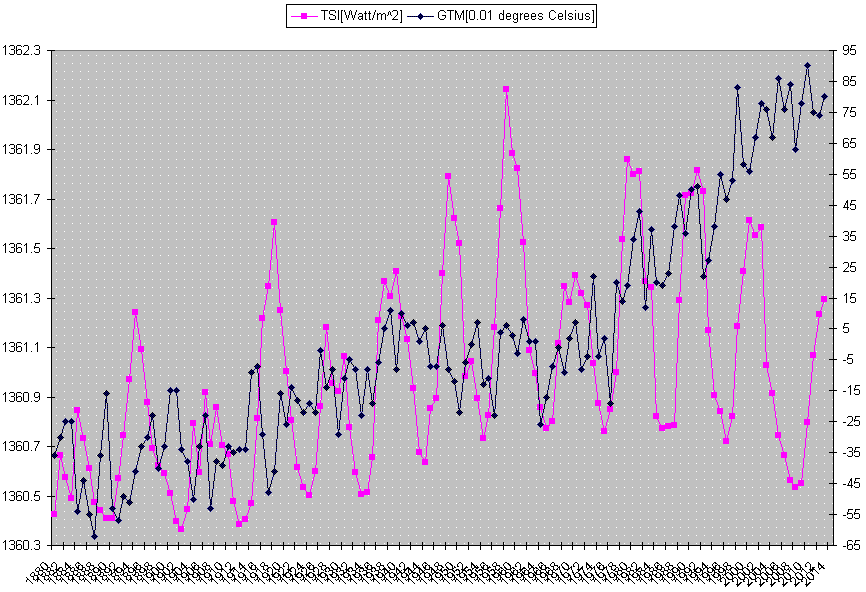
The strength of solar magnetic storms were also increasing to levels not seen before the 1900s
[atsimg]http://files.abovetopsecret.com/images/member/7c0bc3d5e611.jpg[/atsimg]
edit on 3-7-2014 by ElectricUniverse because: add info.
originally posted by: Phage
Yes. It is pretty well accepted that higher (Arctic) latitudes should be experiencing cooling rather than warming. But they aren't.
That's not what the research says Phage... Now you are again trying to change what the research states?...
originally posted by: Phage
Much warmer? It doesn't look like that to me. The chart shows that northern Scandinavia may have been 1 or 2 tenths of a degree warmer during previous Holocene warm periods. In any case, here is what Wilson, a co-author, said about the study:
www.huffingtonpost.co.uk...
Our paper is for northern Scandinavian summer temperatures so extrapolating to large scale annual temperatures is not really correct.
First of all, it seems that Phage doesn't know how to read data from a temperature graph...
What exactly are you looking at that makes you think "it doesn't seem that it was much warmer during other past global warming periods"?...
Let me actually try to help you out by tracing a base line on the graph. Hint: the dotted line is not a baseline of 0 throughout the graph.
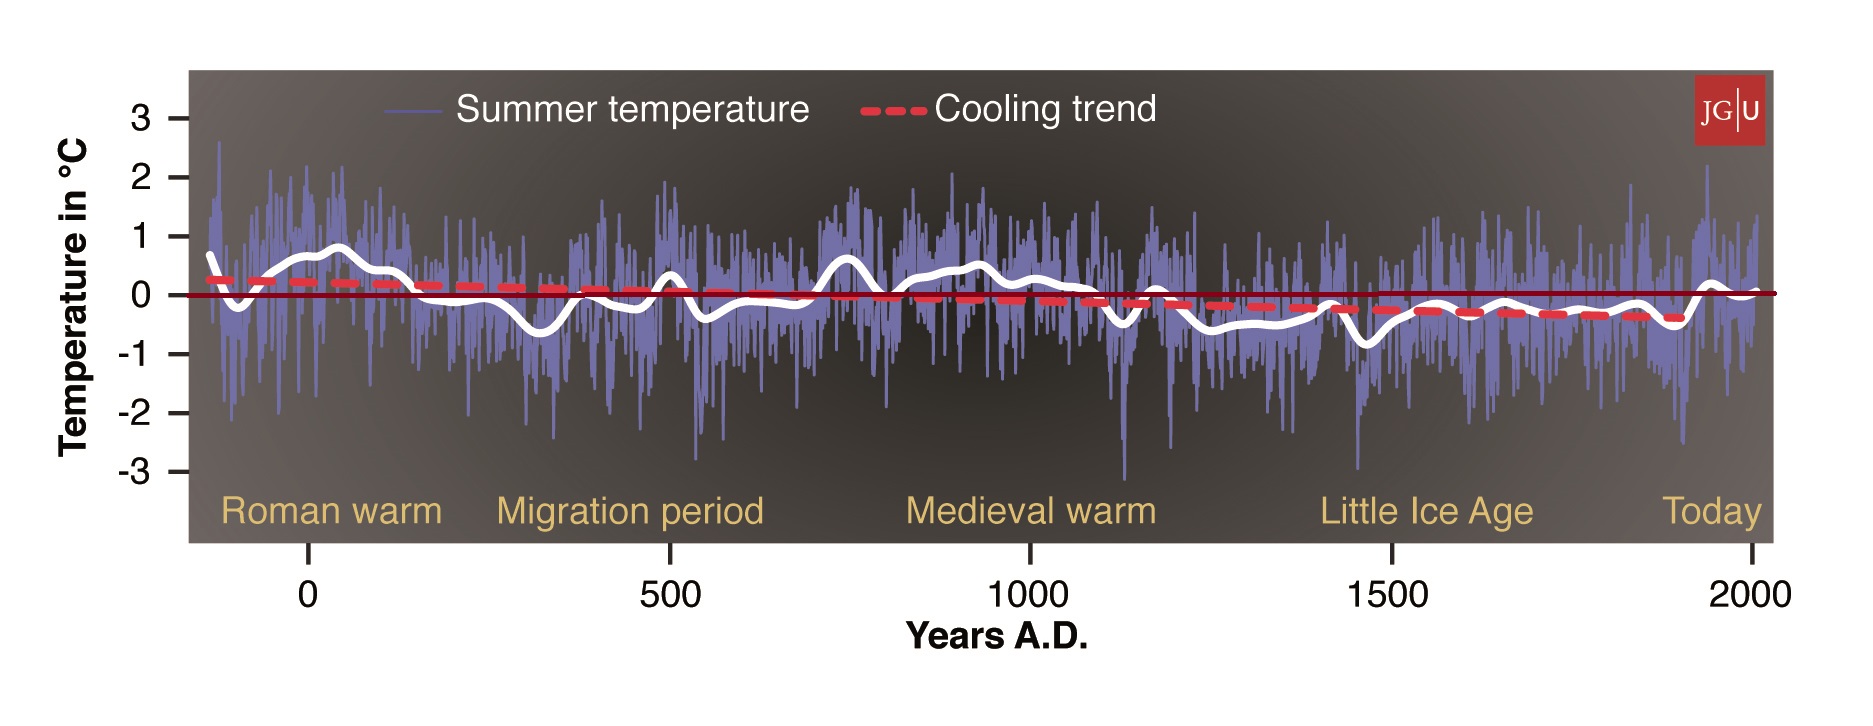
(added: To make it easier to see I have cropped and resized the graph as well as changed the color of the baseline 0 to yellow)
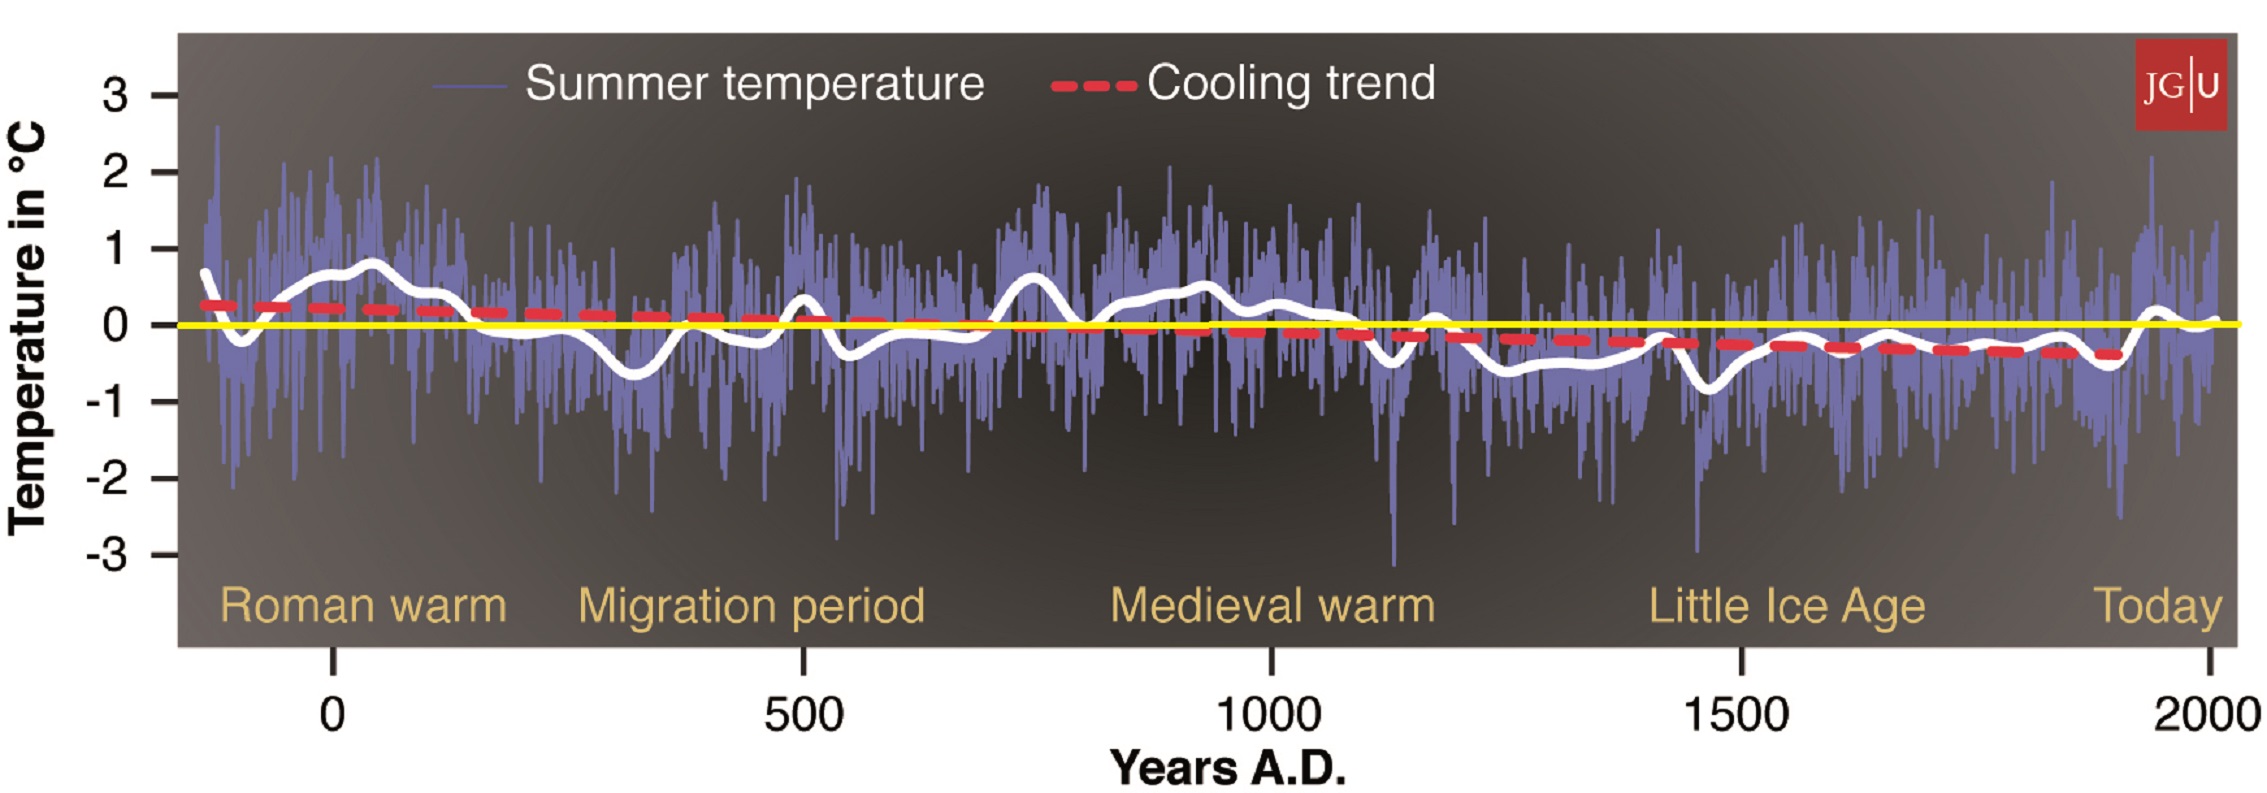
The straight line I plotted on the graph shows a baseline of 0 throughout the data in the graph. Maybe now you will understand that the graph does show the present times has been cooler than the past, at least in the northern hemisphere.
What the dotted line is showing is a cooling trend.
As to this research being just for the northern hemisphere... Have you forgotten, or are you ignoring the past research I have posted from Africa, China, South America, etc, ALL which show that during past warming periods such as the Roman and the Medieval periods it was WARMER than at present times?...
As for the recent extreme weather events being "the most extreme in history" (not exactly what you have said but others have tried to claim this)
doi:10.1016/j.quaint.2007.06.001
Copyright © 2007 Elsevier Ltd and INQUA All rights reserved.
Extreme Nile floods and famines in Medieval Egypt (AD 930–1500) and their climatic implications
References and further reading may be available for this article. To view references and further reading you must purchase this article.
Fekri A. Hassana,
aInstitute of Archaeology, University College London, 31-34 Gordon Square, WC1H 0PY, London, UK
Available online 7 June 2007.
Abstract
Nile gauge records of variations in Nile floods from the 9th century to the 15th century AD reveal pronounced episodes of low Nile and high Nile flood discharge. Historical data reveal that this period was also characterized by the worst known famines on record. Exploratory comparisons of variations in Nile flood discharge with high-resolution data on sea surface temperature of the North Atlantic climate from three case studies suggest that rainfall at the source of the Nile was influenced by the North Atlantic Oscillation. However, there are apparently flip-flop reversals from periods when variations in Nile flood discharge are positively related to North Atlantic warming to periods where the opposite takes place. The key transitions occur atAD 900, 1010, 1070, 1180, 1350 and 1400. The putative flip-flop junctures, which require further confirmation, appear to be quite rapid and some seem to have had dramatic effects on Nile flood discharge, especially if they recurred at short intervals, characteristic of the period from the 9th to the 14th century, coincident with the so-called Medieval Warm Period. The transition from one state to the other was characterized by incidents of low, high or a succession of both low and high extreme floods. The cluster of extreme floods was detrimental causing famines and economic disasters that are unmatched over the last 2000 years.
www.sciencedirect.com
The above is just one of the many instances in the past when dramatic climate changes occurred which have been unmatched even by the tragic dramatic changes that we have seen/experienced so far.
edit on 3-7-2014 by ElectricUniverse because: correct errors.
originally posted by: ElectricUniverse
Therein lies the problem, the majority of the AGW crowd BELIEVE in AGW "because that's what some scientists are telling us". People like you do not base your opinion on evidence but just on "belief", this is what makes AGW the religion of the late 20th century and the beginning of the 21st century...
You see, you should do some real research on AGW instead of basing your opinion "on belief"... Is this what you call science?... To believe what the AGW scientist proponents claim?...
Here are some of the things your AGW scientists have been doing meanwhile people like you, a majority of the AGW crowd, keep basing your opinion on "believing" the lies of the AGW scientists...
It's fun to cherry-pick and sensationalize, isn't it? What do you base your "beliefs" on? The daily mail and "the age", whatever that is? Are you doing your own research, or just digesting whatever is fed to you on the web? I'm going to post a reply I made to a certain rabbit that I think is very relevant - none of us, or at the most very few of us, on ATS are experts on what we're jawing about. Again, I don't know why you "believe" what you believe - I know my why I do though...
It's great to question - question everything. But whose bandwagon are you riding on? Or are you doing your own ice core research? If you have a group of very intelligent people who comprise about 98% of experts in a field, and then you have the other 2% of supposedly intelligent people telling you the opposite - who are going to believe? And why? I find it remarkable the total imbalance that the "consensus" represents in the scientific field, and yet the AGW skeptic crowd represents likely a good majority of a certain party. I can't find any other explanation for the unreasonable denial than party adherence, or groupthink. It's certainly not logical nor is it rational.
a reply to: ElectricUniverse
To add to your post, there was an excellent paper written by Bohm:
dx.doi.org...
His findings:
In a nutshell, they used VERY reliable records of weather data to construct events for the last 250 years and found no major variation in the extremes of climate. (too hot, too cold, too dry, too wet) Why is that I wonder?
~Namaste
To add to your post, there was an excellent paper written by Bohm:
dx.doi.org...
His findings:
- The first result of the study is the clear evidence that there has been no increase of variability during the past 250 years in the region.
- We can show that also this recent anthropogenic normal period [1981-2010, red.] shows no widening of the PDF (probability density function) compared to preceding ones.
- It shows that interannual variability changes show a clear centennial oscillating structure for all three climatic elements [pressure, temperature and precipitation, red.] in the region.
- For the time of being we have no explanation for this empirical evidence.
In a nutshell, they used VERY reliable records of weather data to construct events for the last 250 years and found no major variation in the extremes of climate. (too hot, too cold, too dry, too wet) Why is that I wonder?
~Namaste
a reply to: redtic
Yet nothing more than claims and not an ounce of intelligent reasoning. You are letting your "beliefs" and your "feelings" control your opinion on the subject.
More rhetoric coming from you without any kind of evidence to disprove the evidence provided is not going to change the fact that people like you only "believe" in the lies you are being told by your AGW scientists.
Everything I posted wasn't based on "belief" and unfounded claims, but EVIDENCE and FACTS. You should try to do some research on those yourself. Every response I have seen you post regarding this topic is always the same, a lot of hot air and no facts, no evidence to corroborate such false claims.
Opinions based on false claims does not equal facts, or evidence. You obviously did not even bother to read the evidence I provided which included research done by scientists who have found that the 20th and the beginning of the 21st century is not, and it hasn't been "unprecedented"...
Here is some of the evidence on the outcry from scientists and researchers members of scientific groups who have dared to tell the world that it isn't true that there is, or has been a "consensus of scientists"...
Link
ricochet.com...
The above are just some of the many voices from real scientists who have been trying to warn people about the truth behind AGW and Climate Change.
There is plenty of evidence that other forces are at work heating the oceans, and the Earth, alongside other planets in the Solar System. But let's see the evidence to what has been happening on Earth.
www.cdc.noaa.gov...
Yet nothing more than claims and not an ounce of intelligent reasoning. You are letting your "beliefs" and your "feelings" control your opinion on the subject.
More rhetoric coming from you without any kind of evidence to disprove the evidence provided is not going to change the fact that people like you only "believe" in the lies you are being told by your AGW scientists.
Everything I posted wasn't based on "belief" and unfounded claims, but EVIDENCE and FACTS. You should try to do some research on those yourself. Every response I have seen you post regarding this topic is always the same, a lot of hot air and no facts, no evidence to corroborate such false claims.
Opinions based on false claims does not equal facts, or evidence. You obviously did not even bother to read the evidence I provided which included research done by scientists who have found that the 20th and the beginning of the 21st century is not, and it hasn't been "unprecedented"...
Here is some of the evidence on the outcry from scientists and researchers members of scientific groups who have dared to tell the world that it isn't true that there is, or has been a "consensus of scientists"...
World’s Largest Scientific Society Rejects Man-Made Climate Fears
WORLD’S LARGEST SCIENCE GROUP REJECTING MAN-MADE CLIMATE FEARS
By Marc Morano
July 31, 2009
NewsWithViews.com
An outpouring of skeptical scientists who are members of the American Chemical Society (ACS) are revolting against the group’s editor-in-chief — with some demanding he be removed — after an editorial appeared claiming “the science of anthropogenic climate change is becoming increasingly well established.”
The editorial claimed the “consensus” view was growing “increasingly difficult to challenge, despite the efforts of diehard climate-change deniers.” The editor now admits he is “startled” by the negative reaction from the group’s scientific members. The American Chemical Society bills itself as the “world’s largest scientific society.”
The June 22, 2009 editorial in Chemical and Engineering News by editor in chief Rudy Baum, is facing widespread blowback and condemnation from American Chemical Society member scientists. Baum concluded his editorial by stating that “deniers” are attempting to “derail meaningful efforts to respond to global climate change.”
Dozens of letters were published on July 27, 2009 castigating Baum, with some scientists calling for his replacement as editor-in-chief.
The editorial was met with a swift, passionate and scientific rebuke from Baum’s colleagues. Virtually all of the letters published on July 27 in castigated Baum’s climate science views. Scientists rebuked Baum’s use of the word “deniers” because of the terms “association with Holocaust deniers.” In addition, the scientists called Baum’s editorial: “disgusting”; “a disgrace”; “filled with misinformation”; “unworthy of a scientific periodical” and “pap.”
...
Link
50 NASA Scientists Against Global Warming
James Delingpole · Apr 11 at 1:40am
Science is not a numbers game. As Einstein said when Hitler commissioned a pamphlet called 100 Scientists Against Einstein: "If I were wrong, one would have been enough." (H/T Marc Morano)
Nonetheless, I think we should all be quietly encouraged by the recent letter by 50 former NASA astronauts, engineers and scientists protesting at the way their once-great institution has been prostituting its name in order to promote the great man-made global warming scam.
The letter says:
We, the undersigned, respectfully request that NASA and the Goddard Institute for Space Studies (GISS) refrain from including unproven remarks in public releases and websites. We believe the claims by NASA and GISS, that man-made carbon dioxide is having a catastrophic impact on global climate change are not substantiated, especially when considering thousands of years of empirical data. With hundreds of well-known climate scientists and tens of thousands of other scientists publicly declaring their disbelief in the catastrophic forecasts, coming particularly from the GISS leadership, it is clear that the science is NOT settled.
The unbridled advocacy of CO2 being the major cause of climate change is unbecoming of NASA’s history of making an objective assessment of all available scientific data prior to making decisions or public statements.
As former NASA employees, we feel that NASA’s advocacy of an extreme position, prior to a thorough study of the possible overwhelming impact of natural climate drivers is inappropriate. We request that NASA refrain from including unproven and unsupported remarks in its future releases and websites on this subject. At risk is damage to the exemplary reputation of NASA, NASA’s current or former scientists and employees, and even the reputation of science itself.
ricochet.com...
The above are just some of the many voices from real scientists who have been trying to warn people about the truth behind AGW and Climate Change.
There is plenty of evidence that other forces are at work heating the oceans, and the Earth, alongside other planets in the Solar System. But let's see the evidence to what has been happening on Earth.
Oceanic Influences on Recent Continental Warming
GILBERT P. COMPO
PRASHANT D. SARDESHMUKH
Climate Diagnostics Center,
Cooperative Institute for Research in Environmental Sciences,
University of Colorado, and
Physical Sciences Division, Earth System Research Laboratory,
National Oceanic and Atmospheric Administration
325 Broadway R/PSD1
Boulder CO 80305-3328
[email protected]
(303) 497-6115
(303) 497-6449
Citation:
Compo, G.P., and P.D. Sardeshmukh, 2008: Oceanic influences on recent continental warming. Climate
Dynamics, doi: 10.1007/s00382-008-0448-9.
This article is published by Springer-Verlag. This author-created version is distributed courtesy of Springer-Verlag.
The original publication is available from www.springerlink.com at
www.springerlink.com...
Abstract
Evidence is presented that the recent worldwide land warming has occurred largely in response to a worldwide warming of the oceans rather than as a direct response to increasing greenhouse gases (GHGs) over land.
Atmospheric model simulations of the last half-century with prescribed observed ocean temperature changes, but without prescribed GHG changes, account for most of the land warming. The oceanic influence has occurred through hydrodynamic-radiative teleconnections, primarily by moistening and warming the air over land and increasing the downward longwave radiation at the surface. The oceans may themselves have warmed from a combination of natural and anthropogenic influences.
www.cdc.noaa.gov...
edit on 4-7-2014 by ElectricUniverse because: (no reason given)
a reply to: SonOfTheLawOfOne
Thanks for posting that link. But as you can see, and unfortunately will continue to see is that the majority of the people who still "believe" in the lies behind AGW will continue ignoring facts, and evidence and instead of trying to discuss the subject at hand they will keep making up claims and accusations of "you are a climate denier, big oil must be paying you to say and post those thing, yadi, yadi yada".... It will continue being this way.
These people WANT to be ignorant, and that is the fact. They want to continue "believing" the claims of Mann, Hansen, Jones, Trenberth et al, meanwhile not even trying to digest the fact that what these AGW scientists have been force feeding to them for years is based on lies, distorted and fudged data and exaggerations.
The fact is that nomatter what evidence you bring to these people they will continue to "believe" in AGW and in frauds like Mann, Jones, Trenberth, Hansen, et al. The AGW crowd will continue "believing" simply because AGW is a RELIGION to them.
What is ironic is the fact that many, if not most of these same people are the ones that continue to belittle Judeo-Christian religions and other religions which have nothing to do with the lies behind the AGW New Age religion.
Make no mistake, world governments have realized that they can use this new "religion" to their advantage to implement a One World Government to "combat Climate Change", and in due time these same people will cheer and rejoice with open arms when the world is forced to follow the ideologies of the New One World Religion known as AGW under the auspices of the One World Government.
edit on 4-7-2014 by ElectricUniverse because: (no reason given)
a reply to: ElectricUniverse
Why are you using such ancient data on Total Solar Irradiance to claim things? 2009? 2005?? 2002??? Rather dated. How about seeing what it looks like a bit more recently?
Why are you using such ancient data on Total Solar Irradiance to claim things? 2009? 2005?? 2002??? Rather dated. How about seeing what it looks like a bit more recently?
a reply to: ElectricUniverse
I believe the critique is extrapolating results from a very narrow study. Consider what that paper was about:
1) Summer temperatures
2) northern Scandinavia
It seems to show that summers in northern Scandinavia are getting slightly cooler. One season of four, one area of many. Recall that, if the Gulf Stream breaks down as a result of diminished salinity of the oceans (due to freshwater influx from melting land ice, which itself would be due to increased global temperatures), Europe would suffer considerably cooler temperatures.
originally posted by: SonOfTheLawOfOne
As Ray already pointed out, the percentage of the carbon isotope that represents human emissions is not 40%, so a large part of the increase is from natural sources too.
...
Can you prove that CO2 stayed constant at 280ppm? You can't, because the records show spikes all over the place, some as high as 600ppm, so good luck with that.
...
Science is not decided by wide acceptance and consensus either. It is through experimentation and observation that leads to predictions that can be proven repeatedly. Global warming is still a theory, let's make that distinction very clear. There is no "settled science" as long as you have groups of scientists who keep opposing and presenting evidence that contradicts the claims.
Countless times, "laws" of physics and long-standing ideologies have been challenged and proven to be wrong, after being "widely accepted" or deemed true "by consensus". Everyone agreed that the Earth was flat. By your standards, it should be a FACT still. Yet, someone challenged it and it was PROVEN wrong, even though the ESTABLISHED, AGREED UPON AND CONSENSUS VIEW fought tirelessly that the proof was wrong when the evidence was staring them in the face.
I'd certainly like to know what these natural sources are. We are, indisputably, emitting more than 29 gigatonnes of CO2 into the atmosphere annually. Yet, these papers claim that only around 29 gigatonnes of CO2 can be accounted for as human-emitted, when going by isotopes - in total. These numbers just don't jive with me.
I'd sure like to see this 600ppm CO2 datapoint, or at least the paper it's in.
Researchers submit papers for peer review. That, in and of itself, is relying on consensus of the reviewers that the paper is acceptable for a journal. Other researchers might question those results and try to falsify them, based on how the experiment is conducted. They leap at the chance to disprove something, of course - but it's still a consensus system. It's part of science. Recall the cold fusion experiments, some years back. Most (but not all) research groups trying to reproduce the experiment could not find results to support the initial claims - a consensus that the initial results were erroneous. There are a great many theories in science that are widely accepted but not entirely proven. Evolution, Relativity, etc...
Did you seriously just use the naive flat earth argument to justify this? That was, if it existed, driven by religion - the four corners of the Earth mentioned in the Bible. Claiming that fable is ignorance. Science knew the Earth was round 200 years before Jesus was born. Eratosthenes even calculated a very rough diameter of the Earth using geometry. Not only that, but he estimated (with relative accuracy) the distance from the Sun to the Earth, and from the Earth to the Moon. He determined the Leap Year (365 + 1/4th) system. He died around 194 BC.
a reply to: Greven
This is where some logical thought is needed and why this debate can rage.
Melting ice sheets do not indicate increased global temperatures. It is only caused by either an increase in local temperatures or from volcanic heat from under the ice sheet.
We must examine the causes carefully and not leap to unwarranted conclusions.
P
Recall that, if the Gulf Stream breaks down as a result of diminished salinity of the oceans (due to freshwater influx from melting land ice, which itself would be due to increased global temperatures)
This is where some logical thought is needed and why this debate can rage.
Melting ice sheets do not indicate increased global temperatures. It is only caused by either an increase in local temperatures or from volcanic heat from under the ice sheet.
We must examine the causes carefully and not leap to unwarranted conclusions.
P
new topics
-
Do we live in a simulation similar to The Matrix 1999?
ATS Skunk Works: 40 minutes ago -
BREAKING: O’Keefe Media Uncovers who is really running the White House
US Political Madness: 1 hours ago -
Biden--My Uncle Was Eaten By Cannibals
US Political Madness: 2 hours ago -
"We're All Hamas" Heard at Columbia University Protests
Social Issues and Civil Unrest: 2 hours ago -
The good, the Bad and the Ugly!
Diseases and Pandemics: 3 hours ago -
Russian intelligence officer: explosions at defense factories in the USA and Wales may be sabotage
Weaponry: 6 hours ago -
African "Newcomers" Tell NYC They Don't Like the Free Food or Shelter They've Been Given
Social Issues and Civil Unrest: 7 hours ago -
Russia Flooding
Other Current Events: 8 hours ago -
MULTIPLE SKYMASTER MESSAGES GOING OUT
World War Three: 9 hours ago -
Two Serious Crimes Committed by President JOE BIDEN that are Easy to Impeach Him For.
US Political Madness: 10 hours ago
top topics
-
Go Woke, Go Broke--Forbes Confirms Disney Has Lost Money On Star Wars
Movies: 17 hours ago, 13 flags -
Biden--My Uncle Was Eaten By Cannibals
US Political Madness: 2 hours ago, 11 flags -
Elites disapearing
Political Conspiracies: 15 hours ago, 11 flags -
Pro Hamas protesters at Columbia claim hit with chemical spray
World War Three: 12 hours ago, 11 flags -
BREAKING: O’Keefe Media Uncovers who is really running the White House
US Political Madness: 1 hours ago, 10 flags -
African "Newcomers" Tell NYC They Don't Like the Free Food or Shelter They've Been Given
Social Issues and Civil Unrest: 7 hours ago, 9 flags -
Freddie Mercury
Paranormal Studies: 17 hours ago, 7 flags -
Two Serious Crimes Committed by President JOE BIDEN that are Easy to Impeach Him For.
US Political Madness: 10 hours ago, 6 flags -
911 emergency lines are DOWN across multiple states
Breaking Alternative News: 10 hours ago, 6 flags -
A Personal Cigar UFO/UAP Video footage I have held onto and will release it here and now.
Aliens and UFOs: 15 hours ago, 5 flags
active topics
-
Russian intelligence officer: explosions at defense factories in the USA and Wales may be sabotage
Weaponry • 143 • : Kurokage -
"We're All Hamas" Heard at Columbia University Protests
Social Issues and Civil Unrest • 9 • : JAY1980 -
What do you do to get to sleep and stay asleep ??
Health & Wellness • 105 • : FlyersFan -
Biden--My Uncle Was Eaten By Cannibals
US Political Madness • 25 • : RazorV66 -
Marjorie Taylor Greene Files Motion to Vacate Speaker Mike Johnson
US Political Madness • 59 • : xuenchen -
Russia Flooding
Other Current Events • 10 • : Kurokage -
Nirvana - Immigrant Song
Music • 9 • : Cre8chaos79 -
Revolution in advertising: the Russians launched a unique satellite
Science & Technology • 71 • : purplemer -
Gold and silver prices....woo hoo
History • 76 • : mysterioustranger -
African "Newcomers" Tell NYC They Don't Like the Free Food or Shelter They've Been Given
Social Issues and Civil Unrest • 13 • : Cre8chaos79