It looks like you're using an Ad Blocker.
Please white-list or disable AboveTopSecret.com in your ad-blocking tool.
Thank you.
Some features of ATS will be disabled while you continue to use an ad-blocker.

Weather Channel Co-Founder slams Feds climate report
page: 3share:
a reply to: Greven
As to why it might be a bit lower??? NO warming for 17 years... non... co2 UP, temps, no change... So you think it's the solar minimum and the guy below thinks it's the sea... which was there all along btw so fail to see what difference that makes...
I believe the sun is the main driving factor for temps certainly and the fact remains it has happened before without us even being here! It has nothing to do with us! If this temp rise had never been seen before, fine... It has, many times! Maybe the earth NEEDS to do it? Maybe if we stop it we'll have blowback somewhere else?
There are no guarantees stopping the cycle would be good for earth right?
Also you state that the sun has been in the minimum for a lot or most of that 17 year... Well, seems the suns cycle is every 11 years... So how can your statement be accurate? It's nearly gone round twice in that 17 years... So... ???
EDIT: The graph you posted is in relation to the second link yeah? Why doen't the graph reflect all the years that the data does? Seems the graph cuts off a 100 plus years? Why?
Also, I kinda question graphs like this in general, look at how the hockey stick graph was manipulated and falsified, so... Also the solar minimum relates to what the sun itself is doing yeah? Or does it also take into account earths rotation and position to the sun... As in are we closer or further away etc...
edit on 8-5-2014 by Meee32 because: (no reason given)
originally posted by: SixX18
17 years 9 months? what was that spike? Not saying it is global warming because idc about climate change or weather day to day. Just curious. I think Fukushima would have a bigger impact on our globe than co2. Besides, co2 is naturally occuring. Volcanic erruptions put millions of times more co2 into the air as humans do through Earths history.
Volcanoes have nothing on what humans do annually. I swear, every single thread... often multiple times...
Some of the latest figures suggest humans are putting nearly 30 BILLION metric tonnes of CO2 in the air. Volcanoes average around 200 MILLION metric tonnes of CO2 annually.
originally posted by: Meee32
a reply to: Greven
As to why it might be a bit lower??? NO warming for 17 years... non... co2 UP, temps, no change... So you think it's the solar minimum and the guy below thinks it's the sea... which was there all along btw so fail to see what difference that makes...
I believe the sun is the main driving factor for temps certainly and the fact remains it has happened before without us even being here! It has nothing to do with us! If this temp rise had never been seen before, fine... It has, many times! Maybe the earth NEEDS to do it? Maybe if we stop it we'll have blowback somewhere else?
There are no guarantees stopping the cycle would be good for earth right?
EDIT: The graph you posted is in relation to the second link yeah? Why doen't the graph reflect all the years that the data does? Seems the graph cuts off a 100 plus years? Why?
Also, I kinda question graphs like this in general, look at how the hockey stick graph was manipulated and falsified, so... Also the solar minimum relates to what the sun itself is doing yeah? Or does it also take into account earths rotation and position to the sun... As in are we closer or further away etc...
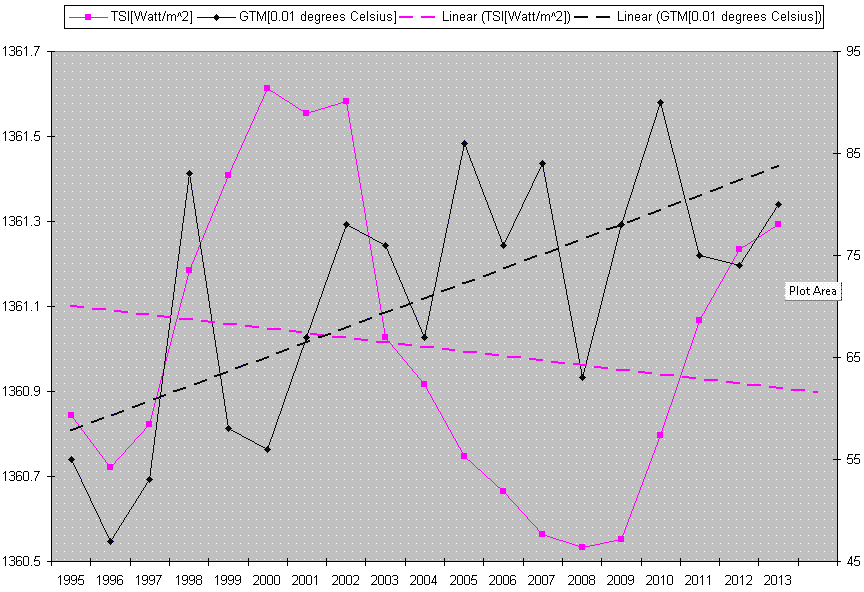
As you can see, the blue line on that chart illustrates measured Global Temperature Mean from 1880 to 2013. Looks like it's been going up to me over that timeline. You can also see the reconstructed (pre-1970s I believe) Total Solar Irradiance as the purple line from the same time frame. Visually, it seems like dips in temperature occur around solar minimums on this time frame. However, it's self-evident that the TSI rose from the beginning of the chart and has long been on the decline... while GTM has rather steadily increased.
The reason for the cutoff on dates is because that's as far back as that link's GTM goes: 1880. I'm merely keeping the data in the same frame of reference. 2014 isn't over yet, so it cuts off on the chart at 2013. The data in both links is simply compiled into a chart form in Microsoft Excel (with some adjustment from the automatic scale to eliminate large areas of blank space). You can literally do this yourself if you don't take my word for it, since I've even given you the links to the data source.
e: as to the solar cycle... it's not 100% of the time 11 years. Look on the chart. That large recent solar minimum is much larger than most of the others.
edit on 0Thu, 08 May 2014 00:28:10 -0500America/ChicagovAmerica/Chicago5 by Greven because: (no reason given)
a reply to: Greven
The link you provided goes back twww.metoffice.gov.uk... 1610 not 1880, which is my point... Also where are your temp figures from? The first link? Want mr to get the articles that state rising temps have stopped? Want me to show you how the ipcc and other scientists are "puzzled" by it? But you say it is still rising... Maybe you should tell them?
EDIT: The "pause" as it is known lmao... Link up top from the met office...
EDIT: We were told that the more co2 we pump the faster the temps will rise... This hasn't happened...
Also please answer... If we have seen rises and drops in temps before, doesn't it indicate it is natural? Then couldn't altering this natural cycle be BAD for earth?
EDIT: Sorry about that link, I dunno why but when I copy paste links using my phone on ats it shoots em all over the place! Lol
EDIT: One more thing... Even if this solar cycle was 17 years instead of 11, your statement still wouldn't be accurate as the high would also be in this period equally! And obviously anywhere in bewteen... How many years are you saying the last cycle lasted?
The link you provided goes back twww.metoffice.gov.uk... 1610 not 1880, which is my point... Also where are your temp figures from? The first link? Want mr to get the articles that state rising temps have stopped? Want me to show you how the ipcc and other scientists are "puzzled" by it? But you say it is still rising... Maybe you should tell them?
EDIT: The "pause" as it is known lmao... Link up top from the met office...
edit on 8-5-2014 by Meee32 because: (no reason given)
EDIT: We were told that the more co2 we pump the faster the temps will rise... This hasn't happened...
Also please answer... If we have seen rises and drops in temps before, doesn't it indicate it is natural? Then couldn't altering this natural cycle be BAD for earth?
edit on 8-5-2014 by Meee32 because: (no reason given)
EDIT: Sorry about that link, I dunno why but when I copy paste links using my phone on ats it shoots em all over the place! Lol
edit on
8-5-2014 by Meee32 because: (no reason given)
EDIT: One more thing... Even if this solar cycle was 17 years instead of 11, your statement still wouldn't be accurate as the high would also be in this period equally! And obviously anywhere in bewteen... How many years are you saying the last cycle lasted?
edit on 8-5-2014 by Meee32
because: (no reason given)
a reply to: Greven
m.bbc.co.uk...
This is a funny article... Says that it's the worst solar minimum in 100 years... The says 10,000... Tthey say that in the 1700's we had a similar minimum and the thames would freeze over so bad that they fates on it! Lol...
Then they touch on climate change and some scientist says that the sun and these solar minimums have very little effect on the earth... Even back in the 1700's... So guess he wouldn't like your theory then? But clearly the sun did have a dramatic effect in 1700's... I wonder if there were doom and gloom articles back then? Maybe they thought it was the end of the world too?
a reply to: jrod
No I don't think we could harm this planet even if we tried... But I guess it depends on what we mean by harm? If all life was wiped off the earth, would that harm the planet? But the planet is a giant malten rock... Maybe it doesn't want flaming plants and animals scurrying all over it? Lol...
Everything we do and use comes from the earth...
Now we cause damage to the ecosystem on earth at different times yeah... Like when there is an oil spill or something... But it is short lived and nothing when compared to the scale of the earth and the time it has been here...
The earth has endured a lot of tutmoil way before we got here... I think people worry too much!
With that being said I am all for using the benefits of nature and working with it etc. I just wish people would cut out the "we're killing the planet", it' just too conceited to think we could do that even if we wanted too...
a reply to: Phage
In what sense? Can you quantify how we are making things worse? I see us providing a lot of information and technology that future generations can build on... Us humans... we ain't all THAT bad.
In what sense? Can you quantify how we are making things worse? I see us providing a lot of information and technology that future generations can build on... Us humans... we ain't all THAT bad.
edit on 8-5-2014 by Meee32 because: (no reason given)
originally posted by: Phage
a reply to: Meee32
How about this?
We're making things a lot worse for our children's children instead of better.
So do you think they will suffer first from climate change or the 17 trillion the government has over spent? On a population of about 317M that would be about 50K for each man, woman, and child in the US. With the deficit going up and wages & business going down they will be slave labor for sure paying off the debt.
a reply to: MarlinGrace
How much of that 17 Trillion debt has to do with wars for oil, subsidies for fossil fuels and most of it was just outright stolen er "gone missing" and no one in the Treasury Dept supposedly has a clue where 13 Trillion dollars went... so 4 Trillion actual debt which is about what the War For Oil err on Terror has cost the US. If we took the bitter pill and increased our debt in the short term in order to bring alternative energies to viable, we'd reduce our debt in the long run.
How much of that 17 Trillion debt has to do with wars for oil, subsidies for fossil fuels and most of it was just outright stolen er "gone missing" and no one in the Treasury Dept supposedly has a clue where 13 Trillion dollars went... so 4 Trillion actual debt which is about what the War For Oil err on Terror has cost the US. If we took the bitter pill and increased our debt in the short term in order to bring alternative energies to viable, we'd reduce our debt in the long run.
a reply to: CaticusMaximus
While methane is, indeed, a greenhouse gas. It's still less than 2 ppm, hardly enough to make any difference at all. According to the NOAA, it's concentration went from 1.65 ppm to 1.85ppm in the last 3 decades. The problem is that much of the absorbance data that is referenced are based on identical concentrations of various gases (mass per volume) injected into a container, then spectrally analyzed in a laboratory setting. In other words - they may take 1% CH4 (methane) w/v, add it to N2 gas, then scan it. 1% methane is 100,000ppm. An absorbance plot is made via wavelength (typically infrared & visible, sometimes UV). The same is done with other gases, some of higher molecular mass than others (e.g. aromatic hydrocarbons). All of these are compared to create relative absorbances (or greenhouse gas factors), and, while accurate, they are taken out of context (in other words, the graphs won't show CH4 at 2ppm, but at 100,000ppm - next to other gases).
The other thing I'd like to note is the argument against eating animals (saying the methane produced is too high, so we should eat all plants instead). Sounds like a good argument, until you find that humans eating veggies will produce just as much methane gas per unit mass AND the fact that meat is 5-10 times more energy dense - requiring 5-10 times as many trucks to haul the plants to market (mostly water), producing even more pollution, not to mention, the manure produced by grazing animals is a natural fertilizer. Oh, did I mention, theses grazing animals take non-human consumable plants and convert to edible food?
edit on 8-5-2014 by beefydog because: typo
All this stuff links to the elite Club of Rome and the UN Agenda 21. I get a lot of flack for posting about it, but you will all see....
It is not man made.This was determined by non gov paid scientist years and years ago.Its an event that nature throws at the planet on a regular
basis.No one wants to listen.
a reply to: Meee32
a reply to: Meee32
Again...
The last full year is 2013 (since it's still 2014), so that's the last data point on the chart.
The first link has a range from 1880 to the present. These are the measured (via ground weather stations and adjusted to remove outliers) Global Temperature Mean (aka average world temperature).
The second link has a range from 1610 to the present. These are the (mostly) reconstructed Total Solar Irradiance (how much energy the sun is sending our way, annual average). I misremembered one thing; the reconstructions are prior to 2003, while 2003 and onward are using satellite measurements.
Because the nearest, earliest date is 1880, I cut away the earlier reconstructed TSI data in this chart. Someone could probably reconstruct TSI with GTM over a longer period using a different data source, but I haven't.
According to this data set, here's your '17yr 9 month pause' from the larger set on the previous chart:
The 'pause' thing originates from satellite data, and is continually repeated by climate change skeptic sites like this one. They get some things rather wrong; check out this paragraph:
A platinum resistance thermometer is not used to measure the temperature of the earth from a satellite. It can't be, look at how they work - they cannot remotely measure temperatures. Instead, a platinum resistance thermometer is used to calibrate the actual remote measurement devices: generally thermal infrared and microwave sounding units. The accuracy of these measuring devices is much worse than that of a platinum resistance thermometer; the platinum resistance thermometer only calibrates what those devices measure for background radiation. Hence, that paragraph is pretty far off the mark.
a reply to: Meee32
Again...
The last full year is 2013 (since it's still 2014), so that's the last data point on the chart.
The first link has a range from 1880 to the present. These are the measured (via ground weather stations and adjusted to remove outliers) Global Temperature Mean (aka average world temperature).
The second link has a range from 1610 to the present. These are the (mostly) reconstructed Total Solar Irradiance (how much energy the sun is sending our way, annual average). I misremembered one thing; the reconstructions are prior to 2003, while 2003 and onward are using satellite measurements.
Because the nearest, earliest date is 1880, I cut away the earlier reconstructed TSI data in this chart. Someone could probably reconstruct TSI with GTM over a longer period using a different data source, but I haven't.
According to this data set, here's your '17yr 9 month pause' from the larger set on the previous chart:
The 'pause' thing originates from satellite data, and is continually repeated by climate change skeptic sites like this one. They get some things rather wrong; check out this paragraph:
2: The satellite datasets are based on measurements made by the most accurate thermometers available – platinum resistance thermometers, which not only measure temperature at various altitudes above the Earth’s surface via microwave sounding units but also constantly calibrate themselves by measuring the known temperature of the cosmic background radiation, which is 1% of the freezing point of water, or just 2.73 degrees above absolute zero. It was by measuring minuscule variations of the cosmic background radiation that the NASA anisotropy probe enabled the age of the Universe to be determined: it is 13.82 billion years.
A platinum resistance thermometer is not used to measure the temperature of the earth from a satellite. It can't be, look at how they work - they cannot remotely measure temperatures. Instead, a platinum resistance thermometer is used to calibrate the actual remote measurement devices: generally thermal infrared and microwave sounding units. The accuracy of these measuring devices is much worse than that of a platinum resistance thermometer; the platinum resistance thermometer only calibrates what those devices measure for background radiation. Hence, that paragraph is pretty far off the mark.
a reply to: SonOfTheLawOfOne
I couldn't agree more.
I also find that comparing weather over the last 100 or so years is misleading. The weather has been changing since the earth formed and we have had several radically different climates than the one we have today. In fact twice over the course of the earths lifetime (a few billion years) the entire surface of the earth has been covered by ice.
I would be more inclined to believe in it if the only answer was something more than just taxing everyone.
Just as an example, I do find it quite baffling that when we build on known and historical flood plains (clues in the name flood plain people) here in the UK (along the Thames and Somerset Levels for example) and then we are surprised and shocked when they get flooded.
We need to inject some common sense and long term thinking in here. Why not change the planning guidelines so that we no longer do this? Its going to save the economic and personal costs that result from flooding. That's right, change our behaviour so that when the weather gets a bit extreme we don't suffer as a result.
But even after the recent flooding, nothing has changed and we continue to build houses on flood plains (despite there being some talk of building and planning regulations being changed to stop this).
Wake up people!
originally posted by: Kali74
a reply to: MarlinGrace
How much of that 17 Trillion debt has to do with wars for oil, subsidies for fossil fuels and most of it was just outright stolen er "gone missing" and no one in the Treasury Dept supposedly has a clue where 13 Trillion dollars went... so 4 Trillion actual debt which is about what the War For Oil err on Terror has cost the US. If we took the bitter pill and increased our debt in the short term in order to bring alternative energies to viable, we'd reduce our debt in the long run.
Are you saying the deficit has nothing to do with entitlement programs? The entire cost of the deficit is because of wars for oil of which we still haven't seen a drop? Isn't 535 million to Solyndra enough to make better solar panels? We already spend 100's of billions in alternative energy grants isn't that enough? Sources would be good here on the trillions spent for oil wars.
a reply to: MarlinGrace
Likewise can you provide sources for that figure of 100s of billions in alternative energy grants?
Here is what I found when I tried to substantiate your claim
As you can see that isn't even close to what you claimed so I guess you must have some different news sources. It would be great to see exactly what you are talking about.
Thanks in advance for the sources.
Likewise can you provide sources for that figure of 100s of billions in alternative energy grants?
Here is what I found when I tried to substantiate your claim
1) The stimulus provided some $90 billion in financing for a wide array of clean energy programs. Here’s the breakdown: There's $29 billion for improving energy efficiency, including home retrofits; $21 billion in incentives for renewable generation, such as solar and wind; $10 billion for modernizing the electric grid; $6 billion to promote advanced vehicles and a domestic battery industry; $18 billion for high-speed rail and other trains; $3 billion for research into carbon capture for coal plants; $3 billion for job training; and $3 billion for clean manufacturing tax credits.
A few caveats. Not all of these programs are strictly Obama programs. Some of them were signed into law by President Bush, but didn't get funding until the stimulus was enacted. An example is ARPA-E, which conducts research into long-shot energy technologies and was first created in 2007. What's more, some programs involve loans or loan guarantees, which means the money will be repaid so long as the companies survive.www.washingtonpost.com...
As you can see that isn't even close to what you claimed so I guess you must have some different news sources. It would be great to see exactly what you are talking about.
Thanks in advance for the sources.
originally posted by: Grimpachi
a reply to: MarlinGrace
Likewise can you provide sources for that figure of 100s of billions in alternative energy grants?
Thanks in advance for the sources.
These are 2009 numbers and you are welcome...
"The greatest economic boon to clean energy research in America came with the passing of the American Recovery and Reinvestment Act of 2009. When the bill became law, it made $275 billion available for federal contracts, grants and loans [source: Recovery.gov]. Of that money, $16.8 billion was allocated to the Office of Energy Efficiency and Renewable Energy (EERE) to fund its core initiatives, including seven programs listed under the umbrella of "renewable energy projects.""
Source
Are one of you now going to provide sources for her claim?
edit on 8-5-2014 by MarlinGrace because: (no reason given)
a reply to: Meee32
Yes we humans are that bad. We are destroying the Earth's ability to support human life. Deforestation is real, desertification is real, overfishing is real, pollution is real and is destroying life, the clean fresh water crisis is real. All of these are man made ecological problems.
We are indeed leaving behind a more trashed version of this planets to our children. To think otherwise is folly. Nothing is being done about it because too many are distracted by the GW debate to see the more immediate problems.
edit on 8-5-2014 by jrod because: 1
new topics
-
God's Righteousness is Greater than Our Wrath
Religion, Faith, And Theology: 3 hours ago -
Electrical tricks for saving money
Education and Media: 6 hours ago -
VP's Secret Service agent brawls with other agents at Andrews
Mainstream News: 7 hours ago -
Sunak spinning the sickness figures
Other Current Events: 8 hours ago -
Nearly 70% Of Americans Want Talks To End War In Ukraine
Political Issues: 8 hours ago -
Late Night with the Devil - a really good unusual modern horror film.
Movies: 10 hours ago -
Cats Used as Live Bait to Train Ferocious Pitbulls in Illegal NYC Dogfighting
Social Issues and Civil Unrest: 11 hours ago
top topics
-
VP's Secret Service agent brawls with other agents at Andrews
Mainstream News: 7 hours ago, 9 flags -
Cats Used as Live Bait to Train Ferocious Pitbulls in Illegal NYC Dogfighting
Social Issues and Civil Unrest: 11 hours ago, 8 flags -
Electrical tricks for saving money
Education and Media: 6 hours ago, 4 flags -
HORRIBLE !! Russian Soldier Drinking Own Urine To Survive In Battle
World War Three: 15 hours ago, 3 flags -
Nearly 70% Of Americans Want Talks To End War In Ukraine
Political Issues: 8 hours ago, 3 flags -
Sunak spinning the sickness figures
Other Current Events: 8 hours ago, 3 flags -
Late Night with the Devil - a really good unusual modern horror film.
Movies: 10 hours ago, 2 flags -
The Good News According to Jesus - Episode 1
Religion, Faith, And Theology: 13 hours ago, 1 flags -
God's Righteousness is Greater than Our Wrath
Religion, Faith, And Theology: 3 hours ago, 0 flags
active topics
-
VP's Secret Service agent brawls with other agents at Andrews
Mainstream News • 41 • : ThatSmellsStrange -
HORRIBLE !! Russian Soldier Drinking Own Urine To Survive In Battle
World War Three • 32 • : DaRAGE -
New whistleblower Jason Sands speaks on Twitter Spaces last night.
Aliens and UFOs • 55 • : baablacksheep1 -
Cats Used as Live Bait to Train Ferocious Pitbulls in Illegal NYC Dogfighting
Social Issues and Civil Unrest • 20 • : Asher47 -
Nearly 70% Of Americans Want Talks To End War In Ukraine
Political Issues • 12 • : Asher47 -
Electrical tricks for saving money
Education and Media • 4 • : Lumenari -
DONALD J. TRUMP - 2024 Candidate for President - His Communications to Americans and the World.
2024 Elections • 514 • : WeMustCare -
The Acronym Game .. Pt.3
General Chit Chat • 7744 • : bally001 -
Truth Social goes public, be careful not to lose your money
Mainstream News • 128 • : Astyanax -
Sunak spinning the sickness figures
Other Current Events • 5 • : glen200376