It looks like you're using an Ad Blocker.
Please white-list or disable AboveTopSecret.com in your ad-blocking tool.
Thank you.
Some features of ATS will be disabled while you continue to use an ad-blocker.

WH Climate Report: Sea Level Could Rise 8 Inches, 11 Inches, 4 Feet, or 6.6 Feet
page: 3share:
The dog and pony show was good enough to sell 9-11 as a terrorist attack to enough people to start a killing that's going on yet today....what makes
one think it wouldn't work for this con job as well.....its all about the money and the power...and we are rapidly giving ours away without a
struggle even.....
Seems like something we should be worried about...doesn't it?
Did you read the report or just the website graphics?
Did you read the report or just the website graphics?
This is a joke right?
There is a 50% chance that the sea may rise 8 or 11 inches in the next 100 years. You know on average the sea has been rising 12 inches per 100 years since the end of the last ice age. That's why the ancient city of Dwarka is now 140 feet under water. So, this report is saying that there is a 50% chance that sea level rise will be less this century than it was last century.
The other point is that the graph they use is only a partial graph. The full graph is here
www.southwestclimatechange.org...
You should note one very important thing from that graph, that is that the correlation between CO2 and temperature has broken. This belies the point that the CO2 correlation is opposite of what is portrayed by the IPCC and MSM. CO2 is an effect of temperature and temperature is the cause of CO2. CO2 actually lags temperature change. And now that correlation has been broken and this puts all the models, all the assumptions, all the lies out there for everyone to see.
Don't believe me, watch suspicious observers www.youtube.com...
Thanks SO
edit on 10-5-2014 by dieseldyk because: (no reason given)
edit on 10-5-2014 by dieseldyk because: (no reason given)
originally posted by: dieseldyk
This is a joke right?
There is a 50% chance that the sea may rise 8 or 11 inches in the next 100 years. You know on average the sea has been rising 12 inches per 100 years since the end of the last ice age. That's why the ancient city of Dwarka is now 140 feet under water. So, this report is saying that there is a 50% chance that sea level rise will be less this century than it was last century.
They are rising, they've been rising. That's not the argument. The problem we're seeing is that they're rising faster than they should be rising. It's not 50% chance they'll rise and 50% chance they won't, it's 50% chance they'll rise 8-11 inches and 50% chance they'll rise more.
The other point is that the graph they use is only a partial graph. The full graph is here
www.southwestclimatechange.org...
You should note one very important thing from that graph, that is that the correlation between CO2 and temperature has broken. This belies the point that the CO2 correlation is opposite of what is portrayed by the IPCC and MSM. CO2 is an effect of temperature and temperature is the cause of CO2. CO2 actually lags temperature change. And now that correlation has been broken and this puts all the models, all the assumptions, all the lies out there for everyone to see.
Don't believe me, watch suspicious observers www.youtube.com...
In the case of warming, the lag between temperature and CO2 is explained as follows: as ocean temperatures rise, oceans release CO2 into the atmosphere. In turn, this release amplifies the warming trend, leading to yet more CO2 being released. In other words, increasing CO2 levels become both the cause and effect of further warming.
Had the natural cycle occurred, the temperature would rise and CO2 would follow and increase the temperature some more. However, the temperature is rising only slightly while the CO2 level is skyrocketing.
Do you honestly believe that such high levels of global CO2 (as illustrated in your provided graph) will have no noticeable effect on global temperature?
originally posted by: dieseldyk
www.southwestclimatechange.org...
You should note one very important thing from that graph, that is that the correlation between CO2 and temperature has broken. This belies the point that the CO2 correlation is opposite of what is portrayed by the IPCC and MSM. CO2 is an effect of temperature and temperature is the cause of CO2. CO2 actually lags temperature change. And now that correlation has been broken and this puts all the models, all the assumptions, all the lies out there for everyone to see.
I'd like to point out that we had an exaggerated in length (closest of similar length was around 1900), and relatively deep (closest of similar lowest point was in the 1930s), solar minimum. This may have had some impact on what seems to be a smaller warming trend over the past decade and a half.
edit on 18Sat, 10 May 2014 18:54:22 -0500America/ChicagovAmerica/Chicago5 by Greven because: (no reason given)
OK, no politics, no name calling, no framing one side or the other as wanting someone to suffer or die.
Let's see the PURE MATH.
What is the total volume of the combined oceans and seas of the entire world. What is the volume of all the ice on Earth minus what is current atop water already. (A full glass of water and ice after the ice melts is actually slightly lower in level). Prove that the on-land volume of ice adds to the total volume of all the connected salt waters on earth so that there is ANY decrease in shoreline anywhere in the world.
The extra weight of the extra water will compress the oceans bottom. Be sure to factor that in. The extra water in the oceans world-wide will also be in climate zones where there will be higher temps and more evaporated water into the atmosphere. More clouds means more sunlight reflected back into space and a colder planet and that water replenishes those arctic regions as snow and ice.
I want numbers, math, physics not politics, fear mongering, name calling (like elementary school children). Temps at the poles going from -75F to -40F is still too cold to melt that ice. That's a 35F degree increase in the global temp in that example.
a reply to: tkwasny
It sounds like you don't believe that the ocean levels would rise even if all the ice in the world melts. Is that the gist of it?
Here are some numbers anyway:
1.332x10^18 m^3 ocean water + 2.65x10^16 m^3 Antarctic ice = 1.359x10^18 m^3
That would be about 70 meters in ocean level rise, or about 230 feet. That's from the Antarctic ice sheet alone.
Does that help?
a reply to: tkwasny
Well I certainly do not have all those figures however I did a search and came up with some for you. However before looking at that I need to clear up something.
It is easy to understand because cloudless nights are generally the coldest.
and
I think you may have a good idea to pursue and I hope these links give you a starting point to collect all the data for the point you are trying to make but this is as far as I go because I just don't have the energy to do it all for you.
Well I certainly do not have all those figures however I did a search and came up with some for you. However before looking at that I need to clear up something.
First the atmosphere can only hold so much moisture due to density constraints so it can only create so much cloud cover second is even if there is a change where there is more cloud cover that would act as an insulator trapping more heat. The oceans and ice packs reflect the suns rays more cloud cover would reflect them back to the earth.
the extra water in the oceans world-wide will also be in climate zones where there will be higher temps and more evaporated water into the atmosphere.
It is easy to understand because cloudless nights are generally the coldest.
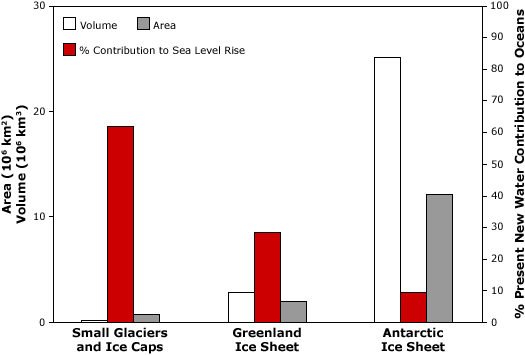
Global sea level is currently rising as a result of both ocean thermal expansion and glacier melt, with each accounting for about half of the observed sea level rise, and each caused by recent increases in global mean temperature. For the period 1961-2003, the observed sea level rise due to thermal expansion was 0.42 millimeters per year and 0.69 millimeters per year due to total glacier melt (small glaciers, ice caps, ice sheets) (IPCC 2007). Between 1993 and 2003, the contribution to sea level rise increased for both sources to 1.60 millimeters per year and 1.19 millimeters per year respectively (IPCC 2007).
Antarctica and Greenland, the world's largest ice sheets, make up the vast majority of the Earth's ice. If these ice sheets melted entirely, sea level would rise by more than 70 meters. However, current estimates indicate that mass balance for the Antarctic ice sheet is in approximate equilibrium and may represent only about 10 percent of the current contribution to sea level rise coming from glaciers. However, some localized areas of the Antarctic have recently shown significant negative balance, e.g., Pine Island and Thwaites Glaciers, and glaciers on the Antarctic Peninsula. There is still much uncertainty about accumulation rates in Antarctica, especially on the East Antarctic Plateau. The Greenland Ice Sheet may be contributing about 30 percent of all glacier melt to rising sea level. Furthermore, recent observations show evidence for increased ice flow rates in some regions of the Greenland Ice Sheet, suggesting that ice dynamics may be a key factor in the response of coastal glaciers and ice sheets to climate change and their role in sea level rise.
In contrast to the polar regions, the network of lower latitude small glaciers and ice caps, although making up only about four percent of the total land ice area or about 760,000 square kilometers, may have provided as much as 60 percent of the total glacier contribution to sea level change since 1990s
See more here
and
For starting purposes, I'll take the density of ice and sea water to be the same. They're not, ice is about 10% less dense. But 10% is close.
The area of the ocean is about 350 million km^2. To raise sea level by 1 m, we need to add 350 million km^2 * 1 m of water. If we have a slab of ice sitting on land, and it were 350 meters thick, then we'd only need one that was 1 million km^2 in area. Greenland is actually about 2.2 million km^2. So each meter of global sea level means about 170 meters of elevation of the Greenland ice sheet.
So 7 meters of sea level means an average elevation/thickness loss of about 1100 meters over the entire area of Greenland.
Greenland's peak thickness is well over 3000 meters (over 2 miles). But not all the area is ice covered, though, granted not much. And not all the volume of the ice cap is above sea level -- the mass of the ice sheet is so great that the crust has sunk below sea level in some places.see more here
The main ice covered landmass is Antarctica at the South Pole, with about 90 percent of the world's ice (and 70 percent of its fresh water). Antarctica is covered with ice an average of 2,133 meters (7,000 feet) thick. If all of the Antarctic ice melted, sea levels around the world would rise about 61 meters (200 feet). But the average temperature in Antarctica is -37°C, so the ice there is in no danger of melting. In fact in most parts of the continent it never gets above freezing.
At the other end of the world, the North Pole, the ice is not nearly as thick as at the South Pole. The ice floats on the Arctic Ocean. If it melted sea levels would not be affected.
There is a significant amount of ice covering Greenland, which would add another 7 meters (20 feet) to the oceans if it melted. Because Greenland is closer to the equator than Antarctica, the temperatures there are higher, so the ice is more likely to melt.
But there might be a less dramatic reason than polar ice melting for the higher ocean level -- the higher temperature of the water. Water is most dense at 4 degrees Celsius. Above and below this temperature, the density of water decreases (the same weight of water occupies a bigger space). So as the overall temperature of the water increases it naturally expands a little bit making the oceans rise.see more here
I think you may have a good idea to pursue and I hope these links give you a starting point to collect all the data for the point you are trying to make but this is as far as I go because I just don't have the energy to do it all for you.
edit on 10-5-2014 by Grimpachi because: (no reason
given)
a reply to: tkwasny
What is the relative effect on continental shelves as opposed to oceanic floors? Will "compression" of the bottom of the Pacific also affect continental land masses? Will the thermal expansion of sea water have the same effect or or not? Be sure to factor in the decrease in density with an increase in temperature (and therefore volume). This is your claim, please provide the pure math.
Pour water into a bowl of water. Does the water level not rise? Please provide the pure math.
Prove that the on-land volume of ice adds to the total volume of all the connected salt waters on earth so that there is ANY decrease in shoreline anywhere in the world.
Will it? How much? Please provide the pure math.
The extra weight of the extra water will compress the oceans bottom. Be sure to factor that in.
What is the relative effect on continental shelves as opposed to oceanic floors? Will "compression" of the bottom of the Pacific also affect continental land masses? Will the thermal expansion of sea water have the same effect or or not? Be sure to factor in the decrease in density with an increase in temperature (and therefore volume). This is your claim, please provide the pure math.
What determines the maximum amount of water vapor in a given volume of air? How much liquid water does a given amount of evaporated water represent? This is your claim, please provide the pure math.
The extra water in the oceans world-wide will also be in climate zones where there will be higher temps and more evaporated water into the atmosphere.
Except that your question above implies that tropical regions may have more cloud cover. Will there be more low level clouds where there is less water vapor due to lower temperatures? Can increased low level cloud cover be expected in polar regions? Will the reduced albedo in arctic regions due to reduced areas of sea ice have any effect on arctic warming? This is your claim, please provide the pure math.
More clouds means more sunlight reflected back into space and a colder planet and that water replenishes those arctic regions as snow and ice.
How close is Greenland to the north pole? What is the average temperature of Greenland? What are the highest temperatures in the Arctic? Will an increase in high temperatures melt more ice? Will increasing sea temperatures melt more sea ice? Will reduced areas of sea ice reduce albedo and increase radiative forcing in the arctic? This is your claim, please provide the pure math.
Temps at the poles going from -75F to -40F is still too cold to melt that ice.
edit on 5/11/2014 by Phage because: (no reason given)
new topics
-
In an Historic First, In N Out Burger Permanently Closes a Location
Mainstream News: 9 minutes ago -
MH370 Again....
Disaster Conspiracies: 41 minutes ago -
Are you ready for the return of Jesus Christ? Have you been cleansed by His blood?
Religion, Faith, And Theology: 2 hours ago -
Chronological time line of open source information
History: 4 hours ago -
A man of the people
Diseases and Pandemics: 5 hours ago -
Ramblings on DNA, blood, and Spirit.
Philosophy and Metaphysics: 5 hours ago -
4 plans of US elites to defeat Russia
New World Order: 7 hours ago -
Thousands Of Young Ukrainian Men Trying To Flee The Country To Avoid Conscription And The War
Other Current Events: 10 hours ago
top topics
-
Israeli Missile Strikes in Iran, Explosions in Syria + Iraq
World War Three: 14 hours ago, 17 flags -
Thousands Of Young Ukrainian Men Trying To Flee The Country To Avoid Conscription And The War
Other Current Events: 10 hours ago, 7 flags -
Iran launches Retalliation Strike 4.18.24
World War Three: 13 hours ago, 6 flags -
12 jurors selected in Trump criminal trial
US Political Madness: 13 hours ago, 4 flags -
4 plans of US elites to defeat Russia
New World Order: 7 hours ago, 4 flags -
A man of the people
Diseases and Pandemics: 5 hours ago, 3 flags -
Chronological time line of open source information
History: 4 hours ago, 2 flags -
In an Historic First, In N Out Burger Permanently Closes a Location
Mainstream News: 9 minutes ago, 2 flags -
Are you ready for the return of Jesus Christ? Have you been cleansed by His blood?
Religion, Faith, And Theology: 2 hours ago, 1 flags -
Ramblings on DNA, blood, and Spirit.
Philosophy and Metaphysics: 5 hours ago, 1 flags
active topics
-
Not Aliens but a Nazi Occult Inspired and then Science Rendered Design.
Aliens and UFOs • 14 • : Caver78 -
Thousands Of Young Ukrainian Men Trying To Flee The Country To Avoid Conscription And The War
Other Current Events • 18 • : Xtrozero -
-@TH3WH17ERABB17- -Q- ---TIME TO SHOW THE WORLD--- -Part- --44--
Dissecting Disinformation • 540 • : IndieA -
12 jurors selected in Trump criminal trial
US Political Madness • 37 • : iaylyan -
Scarface does Tiny Desk Concert
Music • 8 • : zosimov -
In an Historic First, In N Out Burger Permanently Closes a Location
Mainstream News • 0 • : underpass61 -
4 plans of US elites to defeat Russia
New World Order • 28 • : Oldcarpy2 -
Israeli Missile Strikes in Iran, Explosions in Syria + Iraq
World War Three • 72 • : DBCowboy -
Fossils in Greece Suggest Human Ancestors Evolved in Europe, Not Africa
Origins and Creationism • 67 • : strongfp -
Are you ready for the return of Jesus Christ? Have you been cleansed by His blood?
Religion, Faith, And Theology • 10 • : TruthJava